Immigrants from Armenia vs Costa Rican Disability
COMPARE
Immigrants from Armenia
Costa Rican
Disability
Disability Comparison
Immigrants from Armenia
Costa Ricans
11.7%
DISABILITY
41.9/ 100
METRIC RATING
179th/ 347
METRIC RANK
11.4%
DISABILITY
91.9/ 100
METRIC RATING
125th/ 347
METRIC RANK
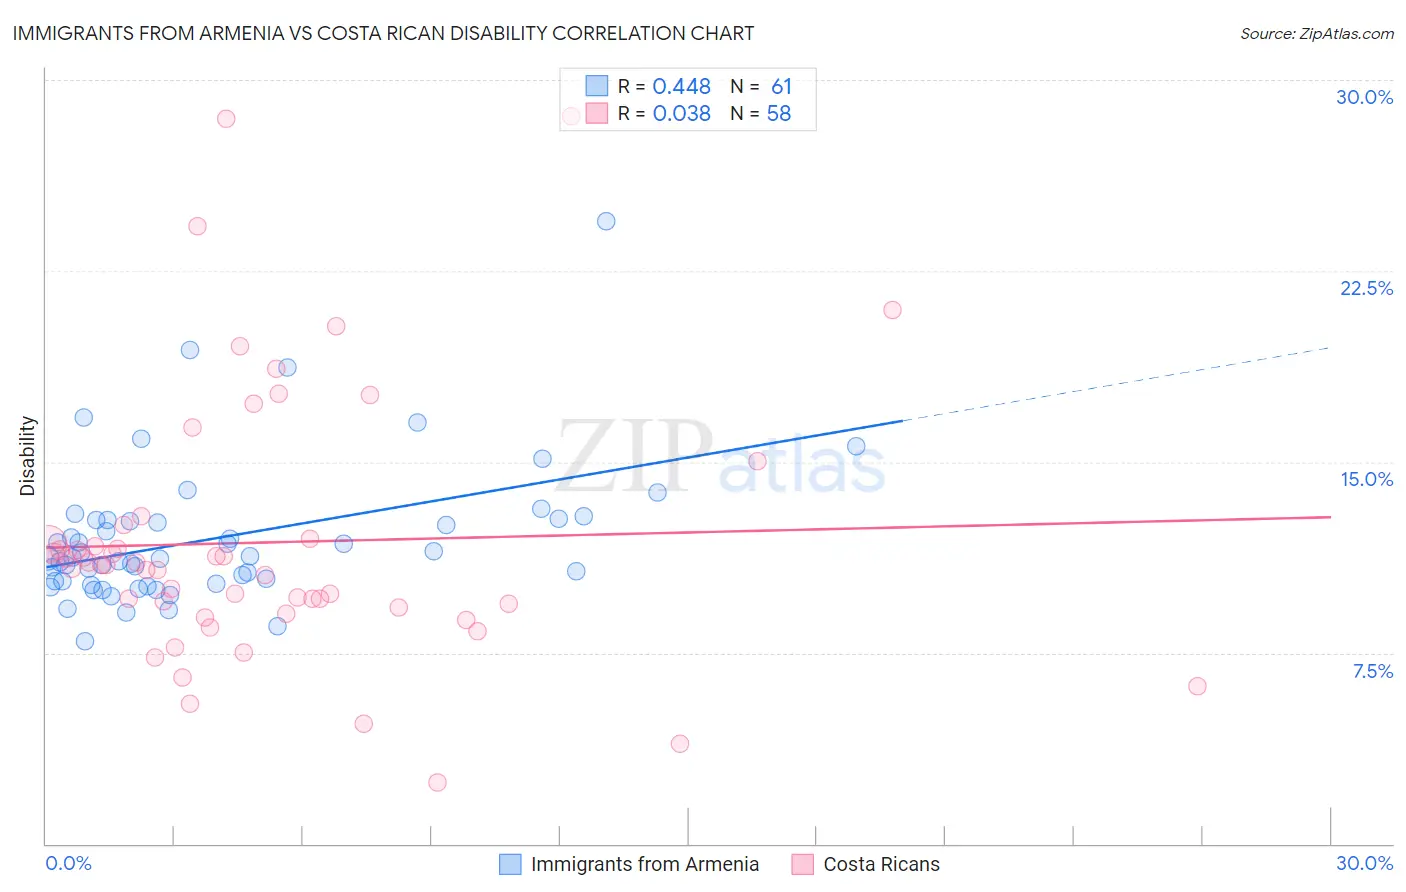
Immigrants from Armenia vs Costa Rican Disability Correlation Chart
The statistical analysis conducted on geographies consisting of 97,710,593 people shows a moderate positive correlation between the proportion of Immigrants from Armenia and percentage of population with a disability in the United States with a correlation coefficient (R) of 0.448 and weighted average of 11.7%. Similarly, the statistical analysis conducted on geographies consisting of 253,574,017 people shows no correlation between the proportion of Costa Ricans and percentage of population with a disability in the United States with a correlation coefficient (R) of 0.038 and weighted average of 11.4%, a difference of 3.1%.
Disability Correlation Summary
| Measurement | Immigrants from Armenia | Costa Rican |
| Minimum | 7.9% | 2.4% |
| Maximum | 24.5% | 28.6% |
| Range | 16.5% | 26.2% |
| Mean | 12.0% | 11.8% |
| Median | 11.2% | 10.9% |
| Interquartile 25% (IQ1) | 10.3% | 9.3% |
| Interquartile 75% (IQ3) | 12.7% | 12.0% |
| Interquartile Range (IQR) | 2.5% | 2.7% |
| Standard Deviation (Sample) | 2.8% | 5.2% |
| Standard Deviation (Population) | 2.8% | 5.2% |
Similar Demographics by Disability
Demographics Similar to Immigrants from Armenia by Disability
In terms of disability, the demographic groups most similar to Immigrants from Armenia are Greek (11.7%, a difference of 0.19%), Immigrants from Honduras (11.8%, a difference of 0.19%), Immigrants from Central America (11.7%, a difference of 0.21%), Immigrants from Western Africa (11.7%, a difference of 0.25%), and Haitian (11.7%, a difference of 0.30%).
| Demographics | Rating | Rank | Disability |
| Trinidadians and Tobagonians | 52.7 /100 | #172 | Average 11.7% |
| Maltese | 50.6 /100 | #173 | Average 11.7% |
| Albanians | 50.0 /100 | #174 | Average 11.7% |
| Haitians | 48.6 /100 | #175 | Average 11.7% |
| Immigrants | Western Africa | 47.5 /100 | #176 | Average 11.7% |
| Immigrants | Central America | 46.6 /100 | #177 | Average 11.7% |
| Greeks | 46.2 /100 | #178 | Average 11.7% |
| Immigrants | Armenia | 41.9 /100 | #179 | Average 11.7% |
| Immigrants | Honduras | 37.8 /100 | #180 | Fair 11.8% |
| Immigrants | Oceania | 34.3 /100 | #181 | Fair 11.8% |
| Icelanders | 34.0 /100 | #182 | Fair 11.8% |
| Hondurans | 31.2 /100 | #183 | Fair 11.8% |
| Iraqis | 30.0 /100 | #184 | Fair 11.8% |
| Immigrants | Burma/Myanmar | 28.5 /100 | #185 | Fair 11.8% |
| Immigrants | Scotland | 28.2 /100 | #186 | Fair 11.8% |
Demographics Similar to Costa Ricans by Disability
In terms of disability, the demographic groups most similar to Costa Ricans are South American Indian (11.4%, a difference of 0.040%), South African (11.4%, a difference of 0.060%), Immigrants from Latvia (11.4%, a difference of 0.15%), Immigrants from Italy (11.4%, a difference of 0.22%), and Immigrants from Europe (11.4%, a difference of 0.22%).
| Demographics | Rating | Rank | Disability |
| Koreans | 93.8 /100 | #118 | Exceptional 11.3% |
| Central Americans | 93.5 /100 | #119 | Exceptional 11.4% |
| Immigrants | North Macedonia | 93.5 /100 | #120 | Exceptional 11.4% |
| Immigrants | Costa Rica | 93.4 /100 | #121 | Exceptional 11.4% |
| Brazilians | 93.3 /100 | #122 | Exceptional 11.4% |
| South Africans | 92.3 /100 | #123 | Exceptional 11.4% |
| South American Indians | 92.2 /100 | #124 | Exceptional 11.4% |
| Costa Ricans | 91.9 /100 | #125 | Exceptional 11.4% |
| Immigrants | Latvia | 90.9 /100 | #126 | Exceptional 11.4% |
| Immigrants | Italy | 90.4 /100 | #127 | Exceptional 11.4% |
| Immigrants | Europe | 90.4 /100 | #128 | Exceptional 11.4% |
| Macedonians | 90.3 /100 | #129 | Exceptional 11.4% |
| Latvians | 89.8 /100 | #130 | Excellent 11.4% |
| Immigrants | Croatia | 89.8 /100 | #131 | Excellent 11.4% |
| Immigrants | Africa | 89.3 /100 | #132 | Excellent 11.4% |