Alaskan Athabascan vs Costa Rican Disability
COMPARE
Alaskan Athabascan
Costa Rican
Disability
Disability Comparison
Alaskan Athabascans
Costa Ricans
14.4%
DISABILITY
0.0/ 100
METRIC RATING
331st/ 347
METRIC RANK
11.4%
DISABILITY
91.9/ 100
METRIC RATING
125th/ 347
METRIC RANK
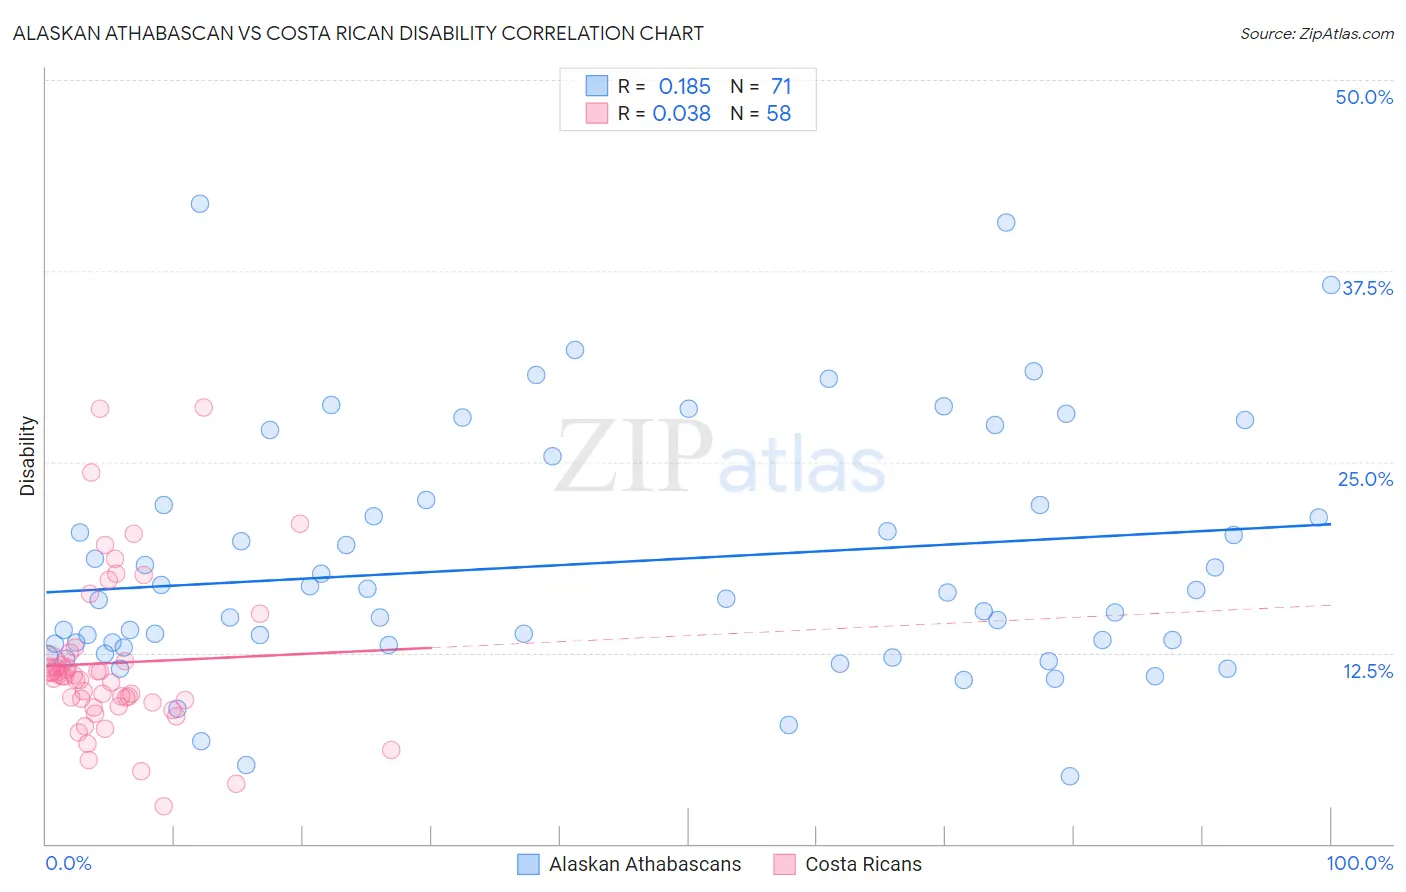
Alaskan Athabascan vs Costa Rican Disability Correlation Chart
The statistical analysis conducted on geographies consisting of 45,821,092 people shows a poor positive correlation between the proportion of Alaskan Athabascans and percentage of population with a disability in the United States with a correlation coefficient (R) of 0.185 and weighted average of 14.4%. Similarly, the statistical analysis conducted on geographies consisting of 253,574,017 people shows no correlation between the proportion of Costa Ricans and percentage of population with a disability in the United States with a correlation coefficient (R) of 0.038 and weighted average of 11.4%, a difference of 26.9%.
Disability Correlation Summary
| Measurement | Alaskan Athabascan | Costa Rican |
| Minimum | 4.4% | 2.4% |
| Maximum | 41.9% | 28.6% |
| Range | 37.5% | 26.2% |
| Mean | 18.3% | 11.8% |
| Median | 16.0% | 10.9% |
| Interquartile 25% (IQ1) | 13.0% | 9.3% |
| Interquartile 75% (IQ3) | 22.2% | 12.0% |
| Interquartile Range (IQR) | 9.2% | 2.7% |
| Standard Deviation (Sample) | 8.0% | 5.2% |
| Standard Deviation (Population) | 8.0% | 5.2% |
Similar Demographics by Disability
Demographics Similar to Alaskan Athabascans by Disability
In terms of disability, the demographic groups most similar to Alaskan Athabascans are Pueblo (14.4%, a difference of 0.020%), Cajun (14.6%, a difference of 1.1%), Yuman (14.6%, a difference of 1.2%), Navajo (14.3%, a difference of 1.3%), and Potawatomi (14.2%, a difference of 1.9%).
| Demographics | Rating | Rank | Disability |
| Chippewa | 0.0 /100 | #324 | Tragic 14.1% |
| Natives/Alaskans | 0.0 /100 | #325 | Tragic 14.2% |
| Osage | 0.0 /100 | #326 | Tragic 14.2% |
| Ottawa | 0.0 /100 | #327 | Tragic 14.2% |
| Immigrants | Azores | 0.0 /100 | #328 | Tragic 14.2% |
| Potawatomi | 0.0 /100 | #329 | Tragic 14.2% |
| Navajo | 0.0 /100 | #330 | Tragic 14.3% |
| Alaskan Athabascans | 0.0 /100 | #331 | Tragic 14.4% |
| Pueblo | 0.0 /100 | #332 | Tragic 14.4% |
| Cajuns | 0.0 /100 | #333 | Tragic 14.6% |
| Yuman | 0.0 /100 | #334 | Tragic 14.6% |
| Tohono O'odham | 0.0 /100 | #335 | Tragic 14.8% |
| Cherokee | 0.0 /100 | #336 | Tragic 14.8% |
| Seminole | 0.0 /100 | #337 | Tragic 14.9% |
| Dutch West Indians | 0.0 /100 | #338 | Tragic 14.9% |
Demographics Similar to Costa Ricans by Disability
In terms of disability, the demographic groups most similar to Costa Ricans are South American Indian (11.4%, a difference of 0.040%), South African (11.4%, a difference of 0.060%), Immigrants from Latvia (11.4%, a difference of 0.15%), Immigrants from Italy (11.4%, a difference of 0.22%), and Immigrants from Europe (11.4%, a difference of 0.22%).
| Demographics | Rating | Rank | Disability |
| Koreans | 93.8 /100 | #118 | Exceptional 11.3% |
| Central Americans | 93.5 /100 | #119 | Exceptional 11.4% |
| Immigrants | North Macedonia | 93.5 /100 | #120 | Exceptional 11.4% |
| Immigrants | Costa Rica | 93.4 /100 | #121 | Exceptional 11.4% |
| Brazilians | 93.3 /100 | #122 | Exceptional 11.4% |
| South Africans | 92.3 /100 | #123 | Exceptional 11.4% |
| South American Indians | 92.2 /100 | #124 | Exceptional 11.4% |
| Costa Ricans | 91.9 /100 | #125 | Exceptional 11.4% |
| Immigrants | Latvia | 90.9 /100 | #126 | Exceptional 11.4% |
| Immigrants | Italy | 90.4 /100 | #127 | Exceptional 11.4% |
| Immigrants | Europe | 90.4 /100 | #128 | Exceptional 11.4% |
| Macedonians | 90.3 /100 | #129 | Exceptional 11.4% |
| Latvians | 89.8 /100 | #130 | Excellent 11.4% |
| Immigrants | Croatia | 89.8 /100 | #131 | Excellent 11.4% |
| Immigrants | Africa | 89.3 /100 | #132 | Excellent 11.4% |