Immigrants from Turkey vs Immigrants from Western Asia Cognitive Disability
COMPARE
Immigrants from Turkey
Immigrants from Western Asia
Cognitive Disability
Cognitive Disability Comparison
Immigrants from Turkey
Immigrants from Western Asia
17.2%
COGNITIVE DISABILITY
56.7/ 100
METRIC RATING
172nd/ 347
METRIC RANK
17.4%
COGNITIVE DISABILITY
29.5/ 100
METRIC RATING
189th/ 347
METRIC RANK
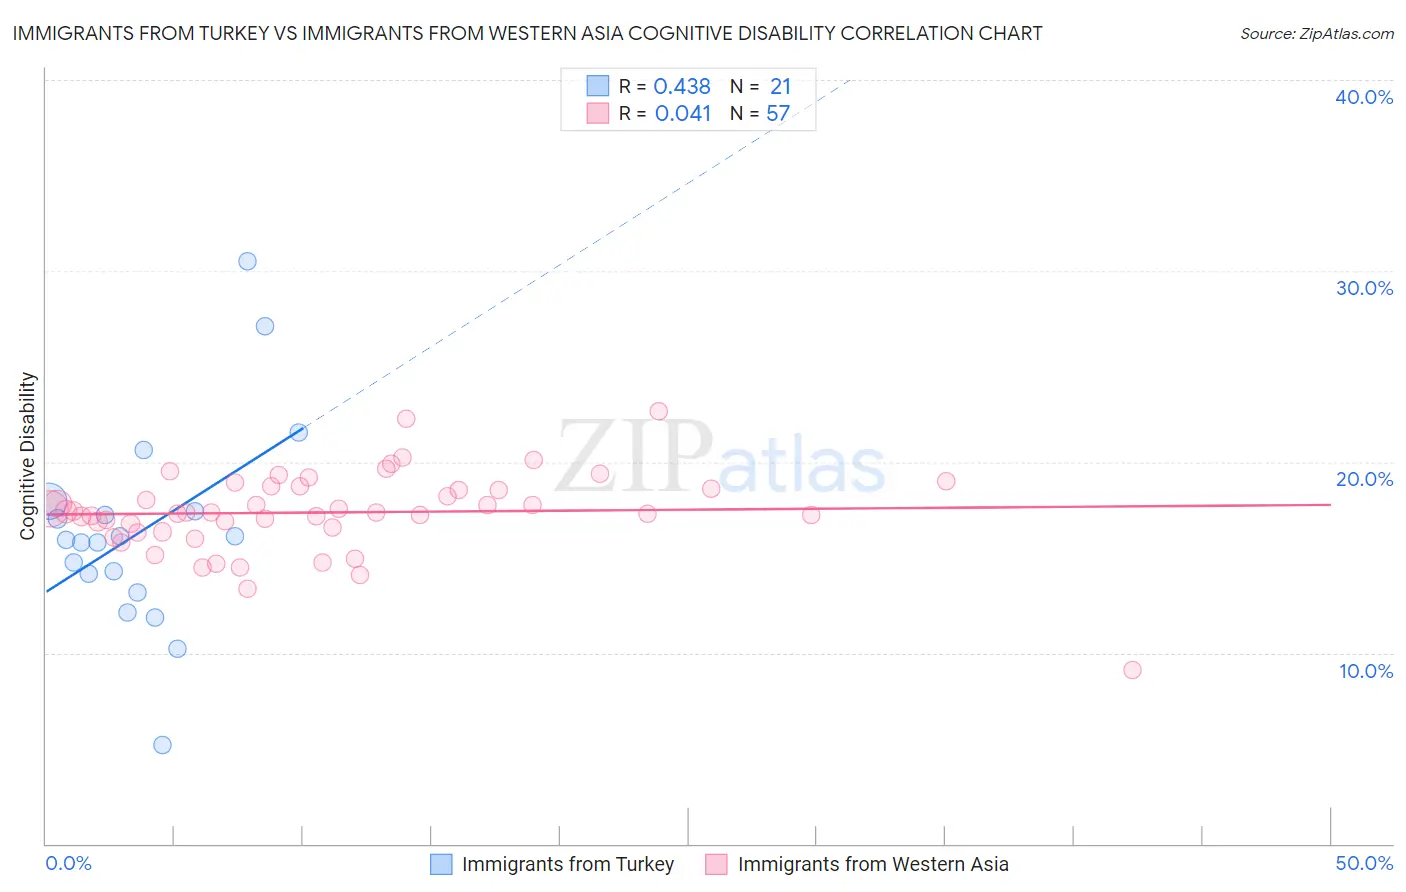
Immigrants from Turkey vs Immigrants from Western Asia Cognitive Disability Correlation Chart
The statistical analysis conducted on geographies consisting of 223,051,603 people shows a moderate positive correlation between the proportion of Immigrants from Turkey and percentage of population with cognitive disability in the United States with a correlation coefficient (R) of 0.438 and weighted average of 17.2%. Similarly, the statistical analysis conducted on geographies consisting of 404,418,073 people shows no correlation between the proportion of Immigrants from Western Asia and percentage of population with cognitive disability in the United States with a correlation coefficient (R) of 0.041 and weighted average of 17.4%, a difference of 0.81%.
Cognitive Disability Correlation Summary
| Measurement | Immigrants from Turkey | Immigrants from Western Asia |
| Minimum | 5.2% | 9.1% |
| Maximum | 30.5% | 22.7% |
| Range | 25.3% | 13.6% |
| Mean | 16.4% | 17.4% |
| Median | 15.9% | 17.4% |
| Interquartile 25% (IQ1) | 13.7% | 16.5% |
| Interquartile 75% (IQ3) | 17.7% | 18.7% |
| Interquartile Range (IQR) | 4.0% | 2.2% |
| Standard Deviation (Sample) | 5.4% | 2.1% |
| Standard Deviation (Population) | 5.3% | 2.1% |
Demographics Similar to Immigrants from Turkey and Immigrants from Western Asia by Cognitive Disability
In terms of cognitive disability, the demographic groups most similar to Immigrants from Turkey are Tlingit-Haida (17.2%, a difference of 0.080%), Ecuadorian (17.2%, a difference of 0.090%), Immigrants from Northern Africa (17.3%, a difference of 0.18%), Laotian (17.3%, a difference of 0.19%), and Tsimshian (17.3%, a difference of 0.20%). Similarly, the demographic groups most similar to Immigrants from Western Asia are Immigrants from France (17.4%, a difference of 0.010%), Immigrants from Spain (17.4%, a difference of 0.060%), Immigrants from Fiji (17.4%, a difference of 0.14%), Cambodian (17.3%, a difference of 0.21%), and Afghan (17.3%, a difference of 0.28%).
| Demographics | Rating | Rank | Cognitive Disability |
| Ecuadorians | 59.6 /100 | #170 | Average 17.2% |
| Tlingit-Haida | 59.4 /100 | #171 | Average 17.2% |
| Immigrants | Turkey | 56.7 /100 | #172 | Average 17.2% |
| Immigrants | Northern Africa | 50.2 /100 | #173 | Average 17.3% |
| Laotians | 50.0 /100 | #174 | Average 17.3% |
| Tsimshian | 49.8 /100 | #175 | Average 17.3% |
| Shoshone | 49.2 /100 | #176 | Average 17.3% |
| Ute | 49.1 /100 | #177 | Average 17.3% |
| Spanish | 48.9 /100 | #178 | Average 17.3% |
| Sioux | 48.6 /100 | #179 | Average 17.3% |
| Pakistanis | 43.9 /100 | #180 | Average 17.3% |
| Immigrants | Guyana | 42.9 /100 | #181 | Average 17.3% |
| Arabs | 42.8 /100 | #182 | Average 17.3% |
| Spaniards | 40.3 /100 | #183 | Average 17.3% |
| Crow | 39.1 /100 | #184 | Fair 17.3% |
| Afghans | 38.2 /100 | #185 | Fair 17.3% |
| Cambodians | 35.9 /100 | #186 | Fair 17.3% |
| Immigrants | Fiji | 33.7 /100 | #187 | Fair 17.4% |
| Immigrants | France | 29.8 /100 | #188 | Fair 17.4% |
| Immigrants | Western Asia | 29.5 /100 | #189 | Fair 17.4% |
| Immigrants | Spain | 27.7 /100 | #190 | Fair 17.4% |