Immigrants from Turkey vs Belizean In Labor Force | Age 45-54
COMPARE
Immigrants from Turkey
Belizean
In Labor Force | Age 45-54
In Labor Force | Age 45-54 Comparison
Immigrants from Turkey
Belizeans
83.6%
IN LABOR FORCE | AGE 45-54
98.8/ 100
METRIC RATING
51st/ 347
METRIC RANK
80.8%
IN LABOR FORCE | AGE 45-54
0.0/ 100
METRIC RATING
284th/ 347
METRIC RANK
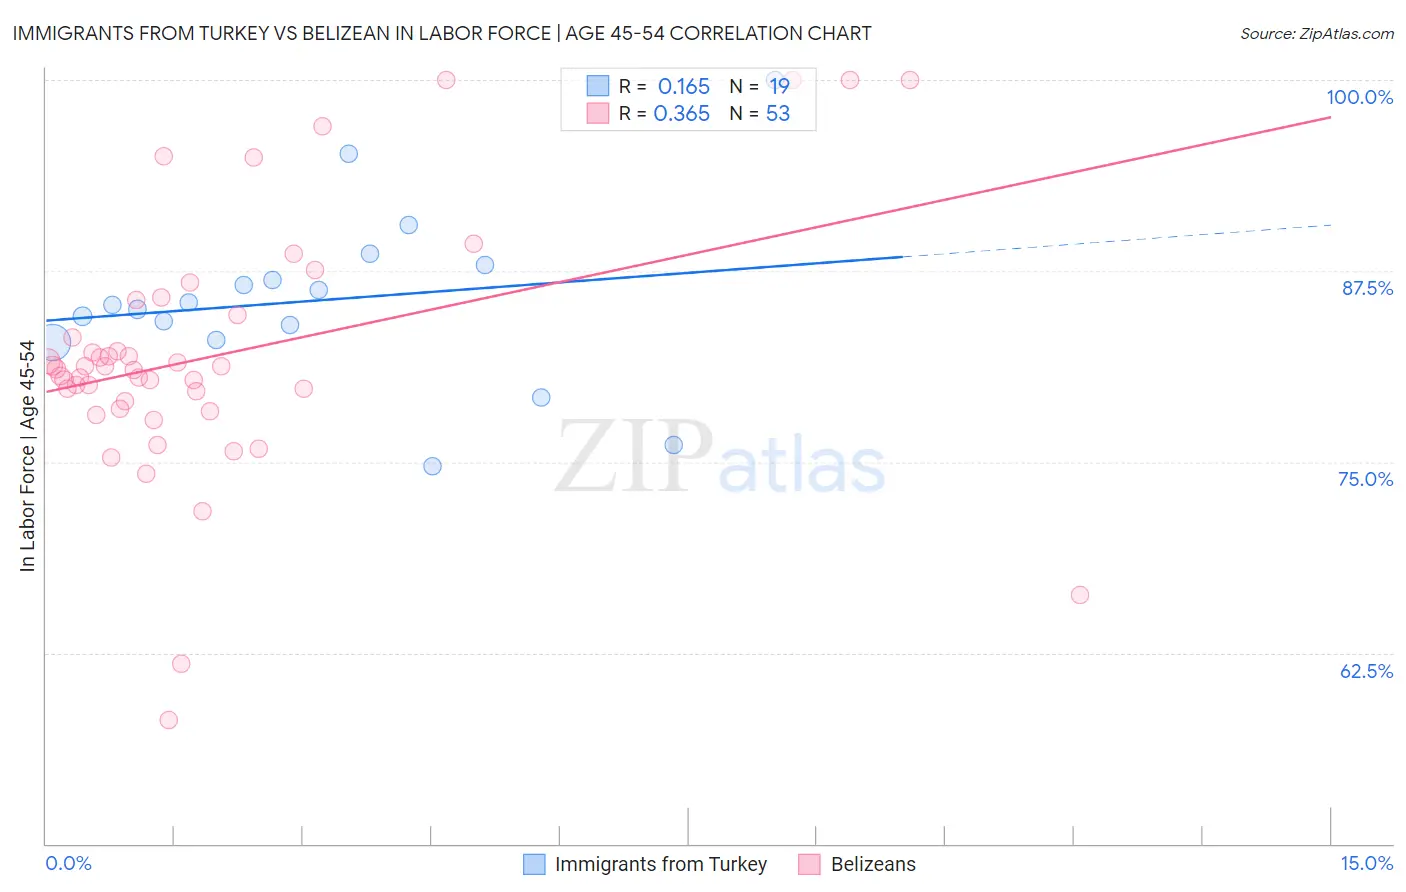
Immigrants from Turkey vs Belizean In Labor Force | Age 45-54 Correlation Chart
The statistical analysis conducted on geographies consisting of 222,959,363 people shows a poor positive correlation between the proportion of Immigrants from Turkey and labor force participation rate among population between the ages 45 and 54 in the United States with a correlation coefficient (R) of 0.165 and weighted average of 83.6%. Similarly, the statistical analysis conducted on geographies consisting of 144,162,526 people shows a mild positive correlation between the proportion of Belizeans and labor force participation rate among population between the ages 45 and 54 in the United States with a correlation coefficient (R) of 0.365 and weighted average of 80.8%, a difference of 3.4%.
In Labor Force | Age 45-54 Correlation Summary
| Measurement | Immigrants from Turkey | Belizean |
| Minimum | 74.7% | 58.1% |
| Maximum | 100.0% | 100.0% |
| Range | 25.3% | 41.9% |
| Mean | 85.6% | 82.0% |
| Median | 85.3% | 81.1% |
| Interquartile 25% (IQ1) | 83.0% | 78.7% |
| Interquartile 75% (IQ3) | 87.9% | 85.1% |
| Interquartile Range (IQR) | 4.9% | 6.4% |
| Standard Deviation (Sample) | 5.8% | 8.4% |
| Standard Deviation (Population) | 5.7% | 8.4% |
Similar Demographics by In Labor Force | Age 45-54
Demographics Similar to Immigrants from Turkey by In Labor Force | Age 45-54
In terms of in labor force | age 45-54, the demographic groups most similar to Immigrants from Turkey are Polish (83.6%, a difference of 0.0%), Peruvian (83.6%, a difference of 0.0%), Immigrants from Greece (83.6%, a difference of 0.010%), Somali (83.5%, a difference of 0.010%), and Macedonian (83.5%, a difference of 0.020%).
| Demographics | Rating | Rank | In Labor Force | Age 45-54 |
| Burmese | 99.1 /100 | #44 | Exceptional 83.6% |
| Immigrants | Hong Kong | 99.1 /100 | #45 | Exceptional 83.6% |
| Lithuanians | 99.1 /100 | #46 | Exceptional 83.6% |
| Croatians | 99.0 /100 | #47 | Exceptional 83.6% |
| Immigrants | Poland | 99.0 /100 | #48 | Exceptional 83.6% |
| Immigrants | Morocco | 99.0 /100 | #49 | Exceptional 83.6% |
| Immigrants | Greece | 98.8 /100 | #50 | Exceptional 83.6% |
| Immigrants | Turkey | 98.8 /100 | #51 | Exceptional 83.6% |
| Poles | 98.7 /100 | #52 | Exceptional 83.6% |
| Peruvians | 98.7 /100 | #53 | Exceptional 83.6% |
| Somalis | 98.7 /100 | #54 | Exceptional 83.5% |
| Macedonians | 98.7 /100 | #55 | Exceptional 83.5% |
| Immigrants | Peru | 98.6 /100 | #56 | Exceptional 83.5% |
| Paraguayans | 98.5 /100 | #57 | Exceptional 83.5% |
| Eastern Europeans | 98.5 /100 | #58 | Exceptional 83.5% |
Demographics Similar to Belizeans by In Labor Force | Age 45-54
In terms of in labor force | age 45-54, the demographic groups most similar to Belizeans are Delaware (80.8%, a difference of 0.010%), Immigrants from Dominica (80.8%, a difference of 0.010%), Vietnamese (80.8%, a difference of 0.020%), Cree (80.8%, a difference of 0.020%), and French American Indian (80.8%, a difference of 0.050%).
| Demographics | Rating | Rank | In Labor Force | Age 45-54 |
| Guatemalans | 0.0 /100 | #277 | Tragic 81.2% |
| Immigrants | Guatemala | 0.0 /100 | #278 | Tragic 81.1% |
| Immigrants | Micronesia | 0.0 /100 | #279 | Tragic 81.1% |
| Immigrants | Latin America | 0.0 /100 | #280 | Tragic 81.0% |
| Immigrants | Grenada | 0.0 /100 | #281 | Tragic 81.0% |
| Aleuts | 0.0 /100 | #282 | Tragic 81.0% |
| French American Indians | 0.0 /100 | #283 | Tragic 80.8% |
| Belizeans | 0.0 /100 | #284 | Tragic 80.8% |
| Delaware | 0.0 /100 | #285 | Tragic 80.8% |
| Immigrants | Dominica | 0.0 /100 | #286 | Tragic 80.8% |
| Vietnamese | 0.0 /100 | #287 | Tragic 80.8% |
| Cree | 0.0 /100 | #288 | Tragic 80.8% |
| Immigrants | Bangladesh | 0.0 /100 | #289 | Tragic 80.7% |
| Mexican American Indians | 0.0 /100 | #290 | Tragic 80.7% |
| Immigrants | Belize | 0.0 /100 | #291 | Tragic 80.6% |