Immigrants from Turkey vs Belizean 1st Grade
COMPARE
Immigrants from Turkey
Belizean
1st Grade
1st Grade Comparison
Immigrants from Turkey
Belizeans
98.0%
1ST GRADE
82.8/ 100
METRIC RATING
141st/ 347
METRIC RANK
96.9%
1ST GRADE
0.0/ 100
METRIC RATING
306th/ 347
METRIC RANK
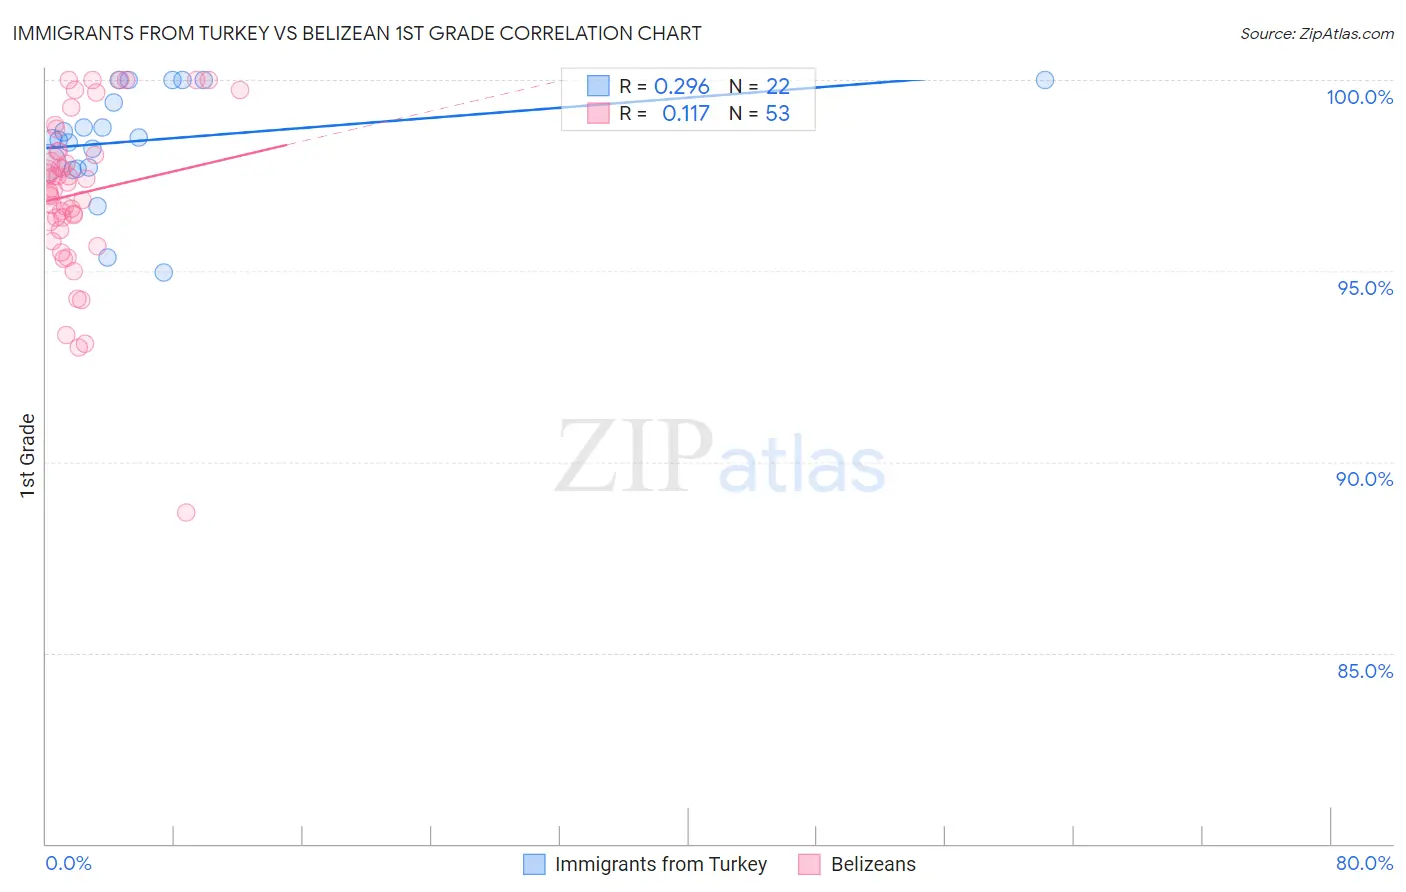
Immigrants from Turkey vs Belizean 1st Grade Correlation Chart
The statistical analysis conducted on geographies consisting of 223,057,877 people shows a weak positive correlation between the proportion of Immigrants from Turkey and percentage of population with at least 1st grade education in the United States with a correlation coefficient (R) of 0.296 and weighted average of 98.0%. Similarly, the statistical analysis conducted on geographies consisting of 144,224,236 people shows a poor positive correlation between the proportion of Belizeans and percentage of population with at least 1st grade education in the United States with a correlation coefficient (R) of 0.117 and weighted average of 96.9%, a difference of 1.1%.
1st Grade Correlation Summary
| Measurement | Immigrants from Turkey | Belizean |
| Minimum | 95.0% | 88.7% |
| Maximum | 100.0% | 100.0% |
| Range | 5.0% | 11.3% |
| Mean | 98.4% | 97.0% |
| Median | 98.5% | 97.1% |
| Interquartile 25% (IQ1) | 97.7% | 96.2% |
| Interquartile 75% (IQ3) | 100.0% | 98.1% |
| Interquartile Range (IQR) | 2.3% | 2.0% |
| Standard Deviation (Sample) | 1.4% | 2.2% |
| Standard Deviation (Population) | 1.4% | 2.1% |
Similar Demographics by 1st Grade
Demographics Similar to Immigrants from Turkey by 1st Grade
In terms of 1st grade, the demographic groups most similar to Immigrants from Turkey are Palestinian (98.0%, a difference of 0.0%), Marshallese (98.0%, a difference of 0.0%), Burmese (98.0%, a difference of 0.010%), Alsatian (98.0%, a difference of 0.010%), and Hmong (98.0%, a difference of 0.020%).
| Demographics | Rating | Rank | 1st Grade |
| Immigrants | Hungary | 89.4 /100 | #134 | Excellent 98.1% |
| Immigrants | Kuwait | 89.3 /100 | #135 | Excellent 98.1% |
| Immigrants | Bulgaria | 88.8 /100 | #136 | Excellent 98.1% |
| Israelis | 87.8 /100 | #137 | Excellent 98.1% |
| Immigrants | Romania | 87.8 /100 | #138 | Excellent 98.1% |
| Blackfeet | 87.6 /100 | #139 | Excellent 98.1% |
| Palestinians | 83.0 /100 | #140 | Excellent 98.0% |
| Immigrants | Turkey | 82.8 /100 | #141 | Excellent 98.0% |
| Marshallese | 82.0 /100 | #142 | Excellent 98.0% |
| Burmese | 81.0 /100 | #143 | Excellent 98.0% |
| Alsatians | 80.9 /100 | #144 | Excellent 98.0% |
| Hmong | 79.0 /100 | #145 | Good 98.0% |
| Immigrants | Israel | 77.8 /100 | #146 | Good 98.0% |
| Filipinos | 77.6 /100 | #147 | Good 98.0% |
| Apache | 75.2 /100 | #148 | Good 98.0% |
Demographics Similar to Belizeans by 1st Grade
In terms of 1st grade, the demographic groups most similar to Belizeans are Immigrants from Somalia (96.9%, a difference of 0.010%), Hispanic or Latino (96.9%, a difference of 0.010%), Immigrants from Haiti (96.9%, a difference of 0.010%), Immigrants from the Azores (96.9%, a difference of 0.020%), and Sri Lankan (96.9%, a difference of 0.040%).
| Demographics | Rating | Rank | 1st Grade |
| Immigrants | Cuba | 0.0 /100 | #299 | Tragic 97.1% |
| Haitians | 0.0 /100 | #300 | Tragic 97.1% |
| Immigrants | South Eastern Asia | 0.0 /100 | #301 | Tragic 97.1% |
| Immigrants | Caribbean | 0.0 /100 | #302 | Tragic 97.0% |
| Somalis | 0.0 /100 | #303 | Tragic 97.0% |
| Nicaraguans | 0.0 /100 | #304 | Tragic 97.0% |
| Ecuadorians | 0.0 /100 | #305 | Tragic 97.0% |
| Belizeans | 0.0 /100 | #306 | Tragic 96.9% |
| Immigrants | Somalia | 0.0 /100 | #307 | Tragic 96.9% |
| Hispanics or Latinos | 0.0 /100 | #308 | Tragic 96.9% |
| Immigrants | Haiti | 0.0 /100 | #309 | Tragic 96.9% |
| Immigrants | Azores | 0.0 /100 | #310 | Tragic 96.9% |
| Sri Lankans | 0.0 /100 | #311 | Tragic 96.9% |
| Cape Verdeans | 0.0 /100 | #312 | Tragic 96.9% |
| Guyanese | 0.0 /100 | #313 | Tragic 96.9% |