Immigrants from Iran vs Tlingit-Haida Cognitive Disability
COMPARE
Immigrants from Iran
Tlingit-Haida
Cognitive Disability
Cognitive Disability Comparison
Immigrants from Iran
Tlingit-Haida
16.5%
COGNITIVE DISABILITY
99.8/ 100
METRIC RATING
54th/ 347
METRIC RANK
17.2%
COGNITIVE DISABILITY
59.4/ 100
METRIC RATING
171st/ 347
METRIC RANK
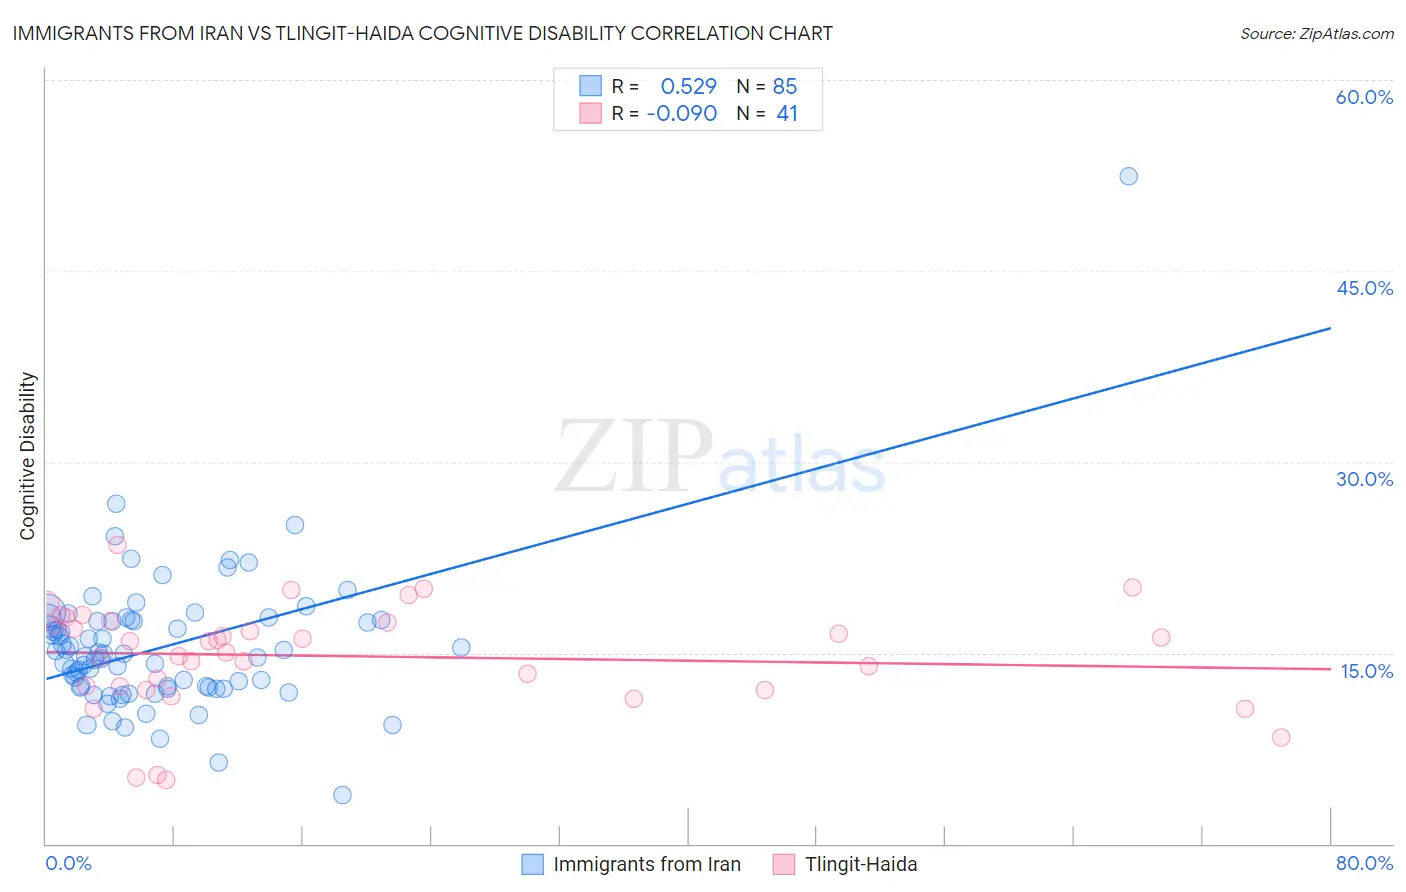
Immigrants from Iran vs Tlingit-Haida Cognitive Disability Correlation Chart
The statistical analysis conducted on geographies consisting of 279,837,445 people shows a substantial positive correlation between the proportion of Immigrants from Iran and percentage of population with cognitive disability in the United States with a correlation coefficient (R) of 0.529 and weighted average of 16.5%. Similarly, the statistical analysis conducted on geographies consisting of 60,855,402 people shows a slight negative correlation between the proportion of Tlingit-Haida and percentage of population with cognitive disability in the United States with a correlation coefficient (R) of -0.090 and weighted average of 17.2%, a difference of 4.2%.
Cognitive Disability Correlation Summary
| Measurement | Immigrants from Iran | Tlingit-Haida |
| Minimum | 3.9% | 5.0% |
| Maximum | 52.5% | 23.4% |
| Range | 48.6% | 18.4% |
| Mean | 15.5% | 14.7% |
| Median | 14.9% | 15.9% |
| Interquartile 25% (IQ1) | 12.3% | 12.2% |
| Interquartile 75% (IQ3) | 17.5% | 17.4% |
| Interquartile Range (IQR) | 5.3% | 5.2% |
| Standard Deviation (Sample) | 5.7% | 4.1% |
| Standard Deviation (Population) | 5.7% | 4.0% |
Similar Demographics by Cognitive Disability
Demographics Similar to Immigrants from Iran by Cognitive Disability
In terms of cognitive disability, the demographic groups most similar to Immigrants from Iran are Swedish (16.5%, a difference of 0.040%), Immigrants from Venezuela (16.5%, a difference of 0.090%), Soviet Union (16.5%, a difference of 0.10%), Immigrants from Korea (16.5%, a difference of 0.14%), and Austrian (16.6%, a difference of 0.18%).
| Demographics | Rating | Rank | Cognitive Disability |
| Immigrants | Italy | 99.8 /100 | #47 | Exceptional 16.5% |
| Immigrants | North America | 99.8 /100 | #48 | Exceptional 16.5% |
| Iranians | 99.8 /100 | #49 | Exceptional 16.5% |
| Norwegians | 99.8 /100 | #50 | Exceptional 16.5% |
| Immigrants | Korea | 99.8 /100 | #51 | Exceptional 16.5% |
| Soviet Union | 99.8 /100 | #52 | Exceptional 16.5% |
| Swedes | 99.8 /100 | #53 | Exceptional 16.5% |
| Immigrants | Iran | 99.8 /100 | #54 | Exceptional 16.5% |
| Immigrants | Venezuela | 99.7 /100 | #55 | Exceptional 16.5% |
| Austrians | 99.7 /100 | #56 | Exceptional 16.6% |
| Bhutanese | 99.7 /100 | #57 | Exceptional 16.6% |
| Pennsylvania Germans | 99.7 /100 | #58 | Exceptional 16.6% |
| Immigrants | Peru | 99.7 /100 | #59 | Exceptional 16.6% |
| Romanians | 99.7 /100 | #60 | Exceptional 16.6% |
| Immigrants | England | 99.6 /100 | #61 | Exceptional 16.6% |
Demographics Similar to Tlingit-Haida by Cognitive Disability
In terms of cognitive disability, the demographic groups most similar to Tlingit-Haida are Ecuadorian (17.2%, a difference of 0.0%), Immigrants from Portugal (17.2%, a difference of 0.070%), Immigrants from Turkey (17.2%, a difference of 0.080%), Immigrants (17.2%, a difference of 0.090%), and Immigrants from Syria (17.2%, a difference of 0.12%).
| Demographics | Rating | Rank | Cognitive Disability |
| Armenians | 70.1 /100 | #164 | Good 17.2% |
| Immigrants | Albania | 64.9 /100 | #165 | Good 17.2% |
| Immigrants | Ecuador | 64.4 /100 | #166 | Good 17.2% |
| Immigrants | Syria | 63.5 /100 | #167 | Good 17.2% |
| Immigrants | Immigrants | 62.5 /100 | #168 | Good 17.2% |
| Immigrants | Portugal | 61.8 /100 | #169 | Good 17.2% |
| Ecuadorians | 59.6 /100 | #170 | Average 17.2% |
| Tlingit-Haida | 59.4 /100 | #171 | Average 17.2% |
| Immigrants | Turkey | 56.7 /100 | #172 | Average 17.2% |
| Immigrants | Northern Africa | 50.2 /100 | #173 | Average 17.3% |
| Laotians | 50.0 /100 | #174 | Average 17.3% |
| Tsimshian | 49.8 /100 | #175 | Average 17.3% |
| Shoshone | 49.2 /100 | #176 | Average 17.3% |
| Ute | 49.1 /100 | #177 | Average 17.3% |
| Spanish | 48.9 /100 | #178 | Average 17.3% |