Immigrants from Trinidad and Tobago vs Panamanian College, 1 year or more
COMPARE
Immigrants from Trinidad and Tobago
Panamanian
College, 1 year or more
College, 1 year or more Comparison
Immigrants from Trinidad and Tobago
Panamanians
55.5%
COLLEGE, 1 YEAR OR MORE
0.7/ 100
METRIC RATING
249th/ 347
METRIC RANK
58.3%
COLLEGE, 1 YEAR OR MORE
19.2/ 100
METRIC RATING
204th/ 347
METRIC RANK
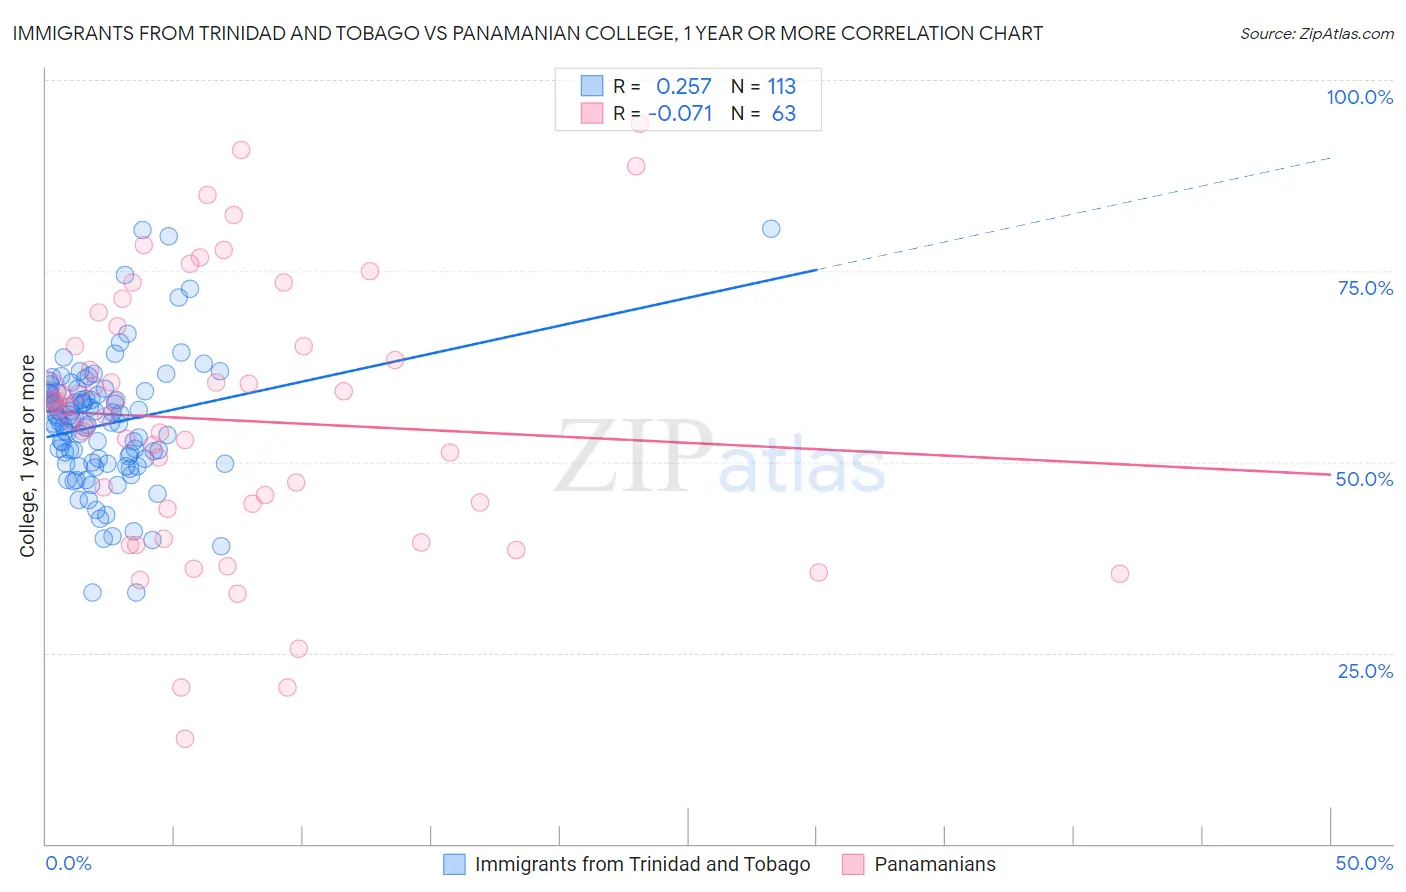
Immigrants from Trinidad and Tobago vs Panamanian College, 1 year or more Correlation Chart
The statistical analysis conducted on geographies consisting of 223,526,872 people shows a weak positive correlation between the proportion of Immigrants from Trinidad and Tobago and percentage of population with at least college, 1 year or more education in the United States with a correlation coefficient (R) of 0.257 and weighted average of 55.5%. Similarly, the statistical analysis conducted on geographies consisting of 281,250,786 people shows a slight negative correlation between the proportion of Panamanians and percentage of population with at least college, 1 year or more education in the United States with a correlation coefficient (R) of -0.071 and weighted average of 58.3%, a difference of 5.0%.
College, 1 year or more Correlation Summary
| Measurement | Immigrants from Trinidad and Tobago | Panamanian |
| Minimum | 32.9% | 13.8% |
| Maximum | 80.5% | 94.2% |
| Range | 47.6% | 80.4% |
| Mean | 54.9% | 55.5% |
| Median | 55.2% | 56.8% |
| Interquartile 25% (IQ1) | 49.8% | 43.9% |
| Interquartile 75% (IQ3) | 58.9% | 65.2% |
| Interquartile Range (IQR) | 9.1% | 21.3% |
| Standard Deviation (Sample) | 8.3% | 17.5% |
| Standard Deviation (Population) | 8.3% | 17.4% |
Similar Demographics by College, 1 year or more
Demographics Similar to Immigrants from Trinidad and Tobago by College, 1 year or more
In terms of college, 1 year or more, the demographic groups most similar to Immigrants from Trinidad and Tobago are Delaware (55.5%, a difference of 0.020%), Immigrants from Congo (55.6%, a difference of 0.10%), Immigrants from Cambodia (55.4%, a difference of 0.11%), Hawaiian (55.6%, a difference of 0.13%), and Aleut (55.4%, a difference of 0.14%).
| Demographics | Rating | Rank | College, 1 year or more |
| Marshallese | 1.0 /100 | #242 | Tragic 55.8% |
| Osage | 1.0 /100 | #243 | Tragic 55.8% |
| Chippewa | 0.9 /100 | #244 | Tragic 55.7% |
| Immigrants | Liberia | 0.8 /100 | #245 | Tragic 55.7% |
| Malaysians | 0.8 /100 | #246 | Tragic 55.6% |
| Hawaiians | 0.8 /100 | #247 | Tragic 55.6% |
| Immigrants | Congo | 0.8 /100 | #248 | Tragic 55.6% |
| Immigrants | Trinidad and Tobago | 0.7 /100 | #249 | Tragic 55.5% |
| Delaware | 0.7 /100 | #250 | Tragic 55.5% |
| Immigrants | Cambodia | 0.6 /100 | #251 | Tragic 55.4% |
| Aleuts | 0.6 /100 | #252 | Tragic 55.4% |
| Immigrants | Barbados | 0.6 /100 | #253 | Tragic 55.4% |
| Japanese | 0.5 /100 | #254 | Tragic 55.2% |
| Immigrants | Bahamas | 0.5 /100 | #255 | Tragic 55.2% |
| Immigrants | West Indies | 0.5 /100 | #256 | Tragic 55.2% |
Demographics Similar to Panamanians by College, 1 year or more
In terms of college, 1 year or more, the demographic groups most similar to Panamanians are Immigrants from Zaire (58.3%, a difference of 0.050%), Immigrants from Vietnam (58.2%, a difference of 0.090%), Ghanaian (58.4%, a difference of 0.14%), Senegalese (58.2%, a difference of 0.21%), and Immigrants from South America (58.4%, a difference of 0.23%).
| Demographics | Rating | Rank | College, 1 year or more |
| Immigrants | Thailand | 26.0 /100 | #197 | Fair 58.6% |
| Immigrants | South Eastern Asia | 25.1 /100 | #198 | Fair 58.5% |
| Slovaks | 24.6 /100 | #199 | Fair 58.5% |
| Spanish | 24.2 /100 | #200 | Fair 58.5% |
| Nigerians | 23.0 /100 | #201 | Fair 58.5% |
| Immigrants | South America | 21.9 /100 | #202 | Fair 58.4% |
| Ghanaians | 20.9 /100 | #203 | Fair 58.4% |
| Panamanians | 19.2 /100 | #204 | Poor 58.3% |
| Immigrants | Zaire | 18.7 /100 | #205 | Poor 58.3% |
| Immigrants | Vietnam | 18.2 /100 | #206 | Poor 58.2% |
| Senegalese | 16.9 /100 | #207 | Poor 58.2% |
| Immigrants | Uruguay | 15.2 /100 | #208 | Poor 58.1% |
| Immigrants | Middle Africa | 14.0 /100 | #209 | Poor 58.0% |
| Tsimshian | 13.5 /100 | #210 | Poor 57.9% |
| Immigrants | Nigeria | 13.3 /100 | #211 | Poor 57.9% |