Immigrants from Thailand vs Spanish American Cognitive Disability
COMPARE
Immigrants from Thailand
Spanish American
Cognitive Disability
Cognitive Disability Comparison
Immigrants from Thailand
Spanish Americans
17.9%
COGNITIVE DISABILITY
0.8/ 100
METRIC RATING
246th/ 347
METRIC RANK
18.0%
COGNITIVE DISABILITY
0.4/ 100
METRIC RATING
265th/ 347
METRIC RANK
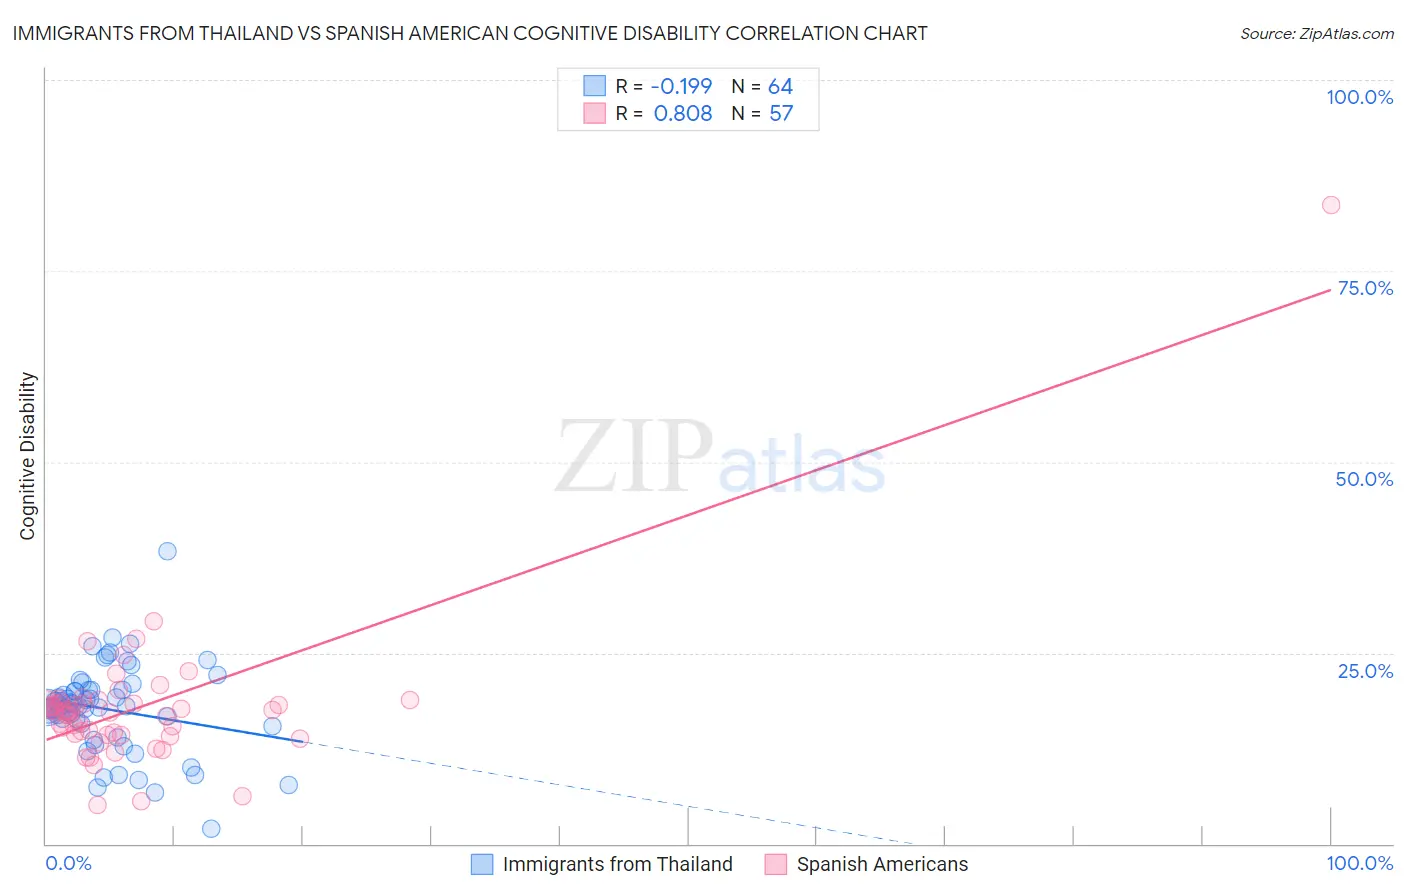
Immigrants from Thailand vs Spanish American Cognitive Disability Correlation Chart
The statistical analysis conducted on geographies consisting of 316,987,546 people shows a poor negative correlation between the proportion of Immigrants from Thailand and percentage of population with cognitive disability in the United States with a correlation coefficient (R) of -0.199 and weighted average of 17.9%. Similarly, the statistical analysis conducted on geographies consisting of 103,167,969 people shows a very strong positive correlation between the proportion of Spanish Americans and percentage of population with cognitive disability in the United States with a correlation coefficient (R) of 0.808 and weighted average of 18.0%, a difference of 0.53%.
Cognitive Disability Correlation Summary
| Measurement | Immigrants from Thailand | Spanish American |
| Minimum | 2.0% | 5.1% |
| Maximum | 38.4% | 83.6% |
| Range | 36.4% | 78.6% |
| Mean | 17.6% | 17.8% |
| Median | 17.9% | 17.4% |
| Interquartile 25% (IQ1) | 15.5% | 14.4% |
| Interquartile 75% (IQ3) | 20.1% | 18.4% |
| Interquartile Range (IQR) | 4.5% | 4.1% |
| Standard Deviation (Sample) | 5.8% | 10.0% |
| Standard Deviation (Population) | 5.8% | 9.9% |
Demographics Similar to Immigrants from Thailand and Spanish Americans by Cognitive Disability
In terms of cognitive disability, the demographic groups most similar to Immigrants from Thailand are Trinidadian and Tobagonian (17.9%, a difference of 0.020%), Samoan (17.9%, a difference of 0.070%), French American Indian (17.9%, a difference of 0.080%), Cree (17.9%, a difference of 0.13%), and Immigrants from Ethiopia (17.9%, a difference of 0.13%). Similarly, the demographic groups most similar to Spanish Americans are Menominee (18.0%, a difference of 0.030%), Immigrants from Barbados (17.9%, a difference of 0.090%), Sierra Leonean (17.9%, a difference of 0.13%), Guamanian/Chamorro (17.9%, a difference of 0.16%), and Immigrants from Belize (17.9%, a difference of 0.21%).
| Demographics | Rating | Rank | Cognitive Disability |
| Trinidadians and Tobagonians | 0.8 /100 | #245 | Tragic 17.9% |
| Immigrants | Thailand | 0.8 /100 | #246 | Tragic 17.9% |
| Samoans | 0.7 /100 | #247 | Tragic 17.9% |
| French American Indians | 0.7 /100 | #248 | Tragic 17.9% |
| Cree | 0.7 /100 | #249 | Tragic 17.9% |
| Immigrants | Ethiopia | 0.7 /100 | #250 | Tragic 17.9% |
| Malaysians | 0.6 /100 | #251 | Tragic 17.9% |
| Immigrants | Grenada | 0.6 /100 | #252 | Tragic 17.9% |
| Hopi | 0.6 /100 | #253 | Tragic 17.9% |
| Hispanics or Latinos | 0.6 /100 | #254 | Tragic 17.9% |
| Immigrants | Azores | 0.6 /100 | #255 | Tragic 17.9% |
| Bahamians | 0.6 /100 | #256 | Tragic 17.9% |
| Mexican American Indians | 0.6 /100 | #257 | Tragic 17.9% |
| Immigrants | Armenia | 0.6 /100 | #258 | Tragic 17.9% |
| Ethiopians | 0.5 /100 | #259 | Tragic 17.9% |
| Immigrants | Belize | 0.5 /100 | #260 | Tragic 17.9% |
| Guamanians/Chamorros | 0.5 /100 | #261 | Tragic 17.9% |
| Sierra Leoneans | 0.4 /100 | #262 | Tragic 17.9% |
| Immigrants | Barbados | 0.4 /100 | #263 | Tragic 17.9% |
| Menominee | 0.4 /100 | #264 | Tragic 18.0% |
| Spanish Americans | 0.4 /100 | #265 | Tragic 18.0% |