Nicaraguan vs Immigrants from Argentina Vision Disability
COMPARE
Nicaraguan
Immigrants from Argentina
Vision Disability
Vision Disability Comparison
Nicaraguans
Immigrants from Argentina
2.3%
VISION DISABILITY
2.2/ 100
METRIC RATING
230th/ 347
METRIC RANK
2.0%
VISION DISABILITY
98.9/ 100
METRIC RATING
66th/ 347
METRIC RANK
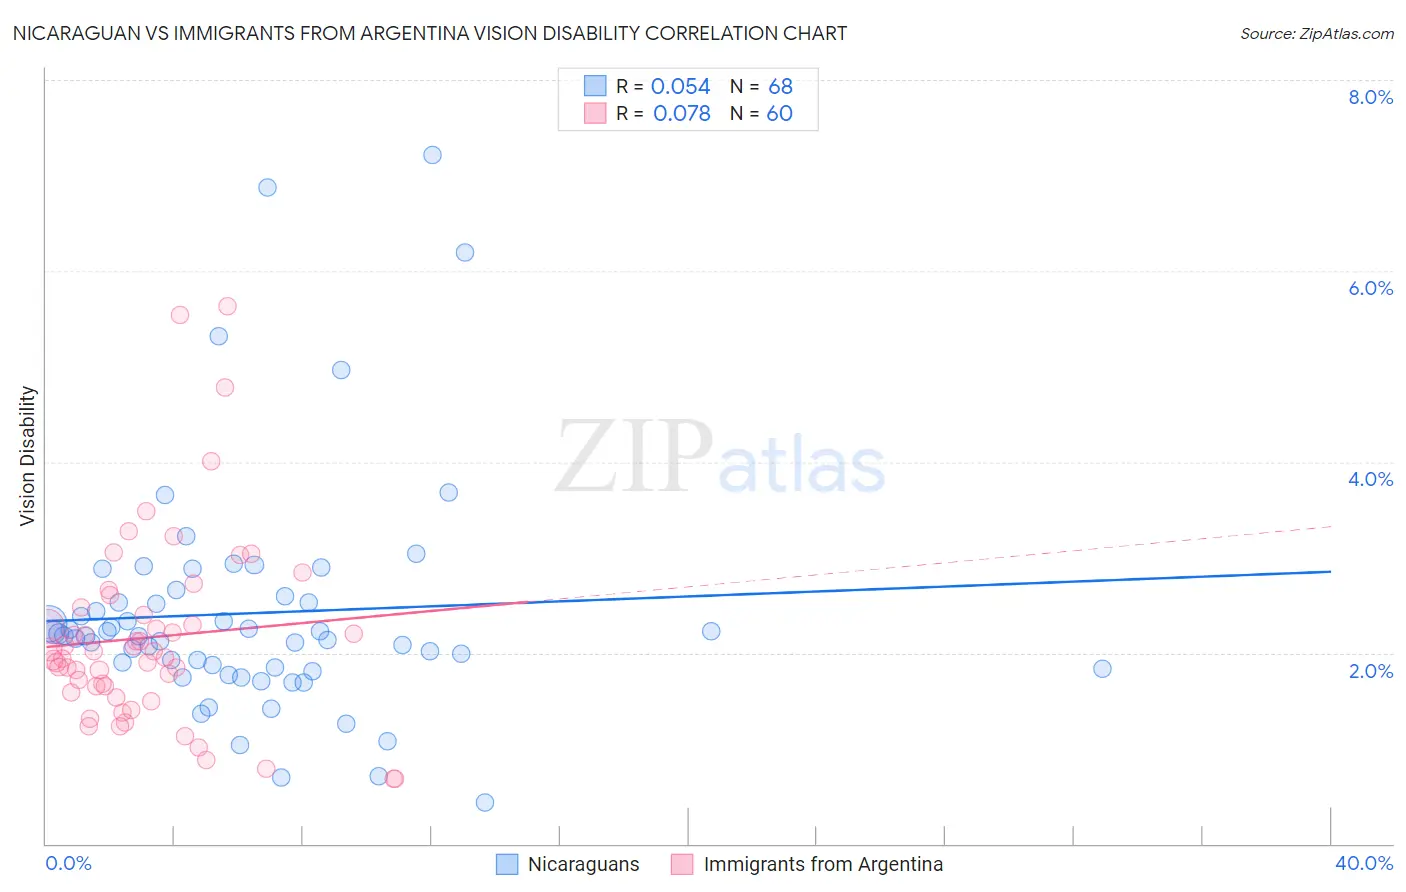
Nicaraguan vs Immigrants from Argentina Vision Disability Correlation Chart
The statistical analysis conducted on geographies consisting of 285,594,144 people shows a slight positive correlation between the proportion of Nicaraguans and percentage of population with vision disability in the United States with a correlation coefficient (R) of 0.054 and weighted average of 2.3%. Similarly, the statistical analysis conducted on geographies consisting of 264,359,612 people shows a slight positive correlation between the proportion of Immigrants from Argentina and percentage of population with vision disability in the United States with a correlation coefficient (R) of 0.078 and weighted average of 2.0%, a difference of 14.0%.
Vision Disability Correlation Summary
| Measurement | Nicaraguan | Immigrants from Argentina |
| Minimum | 0.44% | 0.68% |
| Maximum | 7.2% | 5.6% |
| Range | 6.8% | 4.9% |
| Mean | 2.4% | 2.2% |
| Median | 2.2% | 2.0% |
| Interquartile 25% (IQ1) | 1.8% | 1.6% |
| Interquartile 75% (IQ3) | 2.6% | 2.4% |
| Interquartile Range (IQR) | 0.73% | 0.82% |
| Standard Deviation (Sample) | 1.2% | 1.0% |
| Standard Deviation (Population) | 1.2% | 0.99% |
Similar Demographics by Vision Disability
Demographics Similar to Nicaraguans by Vision Disability
In terms of vision disability, the demographic groups most similar to Nicaraguans are Welsh (2.3%, a difference of 0.070%), Hmong (2.3%, a difference of 0.15%), Immigrants from Ecuador (2.3%, a difference of 0.16%), German Russian (2.3%, a difference of 0.35%), and Central American (2.3%, a difference of 0.36%).
| Demographics | Rating | Rank | Vision Disability |
| Basques | 3.5 /100 | #223 | Tragic 2.3% |
| Irish | 3.4 /100 | #224 | Tragic 2.3% |
| Immigrants | Western Africa | 3.4 /100 | #225 | Tragic 2.3% |
| Immigrants | Germany | 3.0 /100 | #226 | Tragic 2.3% |
| Hawaiians | 2.9 /100 | #227 | Tragic 2.3% |
| Hmong | 2.5 /100 | #228 | Tragic 2.3% |
| Welsh | 2.3 /100 | #229 | Tragic 2.3% |
| Nicaraguans | 2.2 /100 | #230 | Tragic 2.3% |
| Immigrants | Ecuador | 2.0 /100 | #231 | Tragic 2.3% |
| German Russians | 1.8 /100 | #232 | Tragic 2.3% |
| Central Americans | 1.8 /100 | #233 | Tragic 2.3% |
| Scottish | 1.6 /100 | #234 | Tragic 2.3% |
| Marshallese | 1.5 /100 | #235 | Tragic 2.3% |
| Immigrants | Congo | 1.4 /100 | #236 | Tragic 2.3% |
| Immigrants | Portugal | 1.4 /100 | #237 | Tragic 2.3% |
Demographics Similar to Immigrants from Argentina by Vision Disability
In terms of vision disability, the demographic groups most similar to Immigrants from Argentina are Maltese (2.0%, a difference of 0.060%), Immigrants from Northern Africa (2.0%, a difference of 0.11%), Immigrants from Greece (2.0%, a difference of 0.13%), Immigrants from Czechoslovakia (2.0%, a difference of 0.21%), and Armenian (2.0%, a difference of 0.26%).
| Demographics | Rating | Rank | Vision Disability |
| Argentineans | 99.1 /100 | #59 | Exceptional 2.0% |
| Immigrants | Romania | 99.1 /100 | #60 | Exceptional 2.0% |
| Immigrants | Belgium | 99.1 /100 | #61 | Exceptional 2.0% |
| Immigrants | Russia | 99.1 /100 | #62 | Exceptional 2.0% |
| Armenians | 99.0 /100 | #63 | Exceptional 2.0% |
| Immigrants | Greece | 99.0 /100 | #64 | Exceptional 2.0% |
| Maltese | 98.9 /100 | #65 | Exceptional 2.0% |
| Immigrants | Argentina | 98.9 /100 | #66 | Exceptional 2.0% |
| Immigrants | Northern Africa | 98.8 /100 | #67 | Exceptional 2.0% |
| Immigrants | Czechoslovakia | 98.7 /100 | #68 | Exceptional 2.0% |
| Russians | 98.6 /100 | #69 | Exceptional 2.0% |
| Immigrants | Kazakhstan | 98.6 /100 | #70 | Exceptional 2.0% |
| Immigrants | Northern Europe | 98.6 /100 | #71 | Exceptional 2.0% |
| Immigrants | France | 98.5 /100 | #72 | Exceptional 2.0% |
| Immigrants | Eritrea | 98.4 /100 | #73 | Exceptional 2.0% |