Immigrants from Taiwan vs American Male Disability
COMPARE
Immigrants from Taiwan
American
Male Disability
Male Disability Comparison
Immigrants from Taiwan
Americans
9.1%
MALE DISABILITY
100.0/ 100
METRIC RATING
2nd/ 347
METRIC RANK
13.8%
MALE DISABILITY
0.0/ 100
METRIC RATING
319th/ 347
METRIC RANK
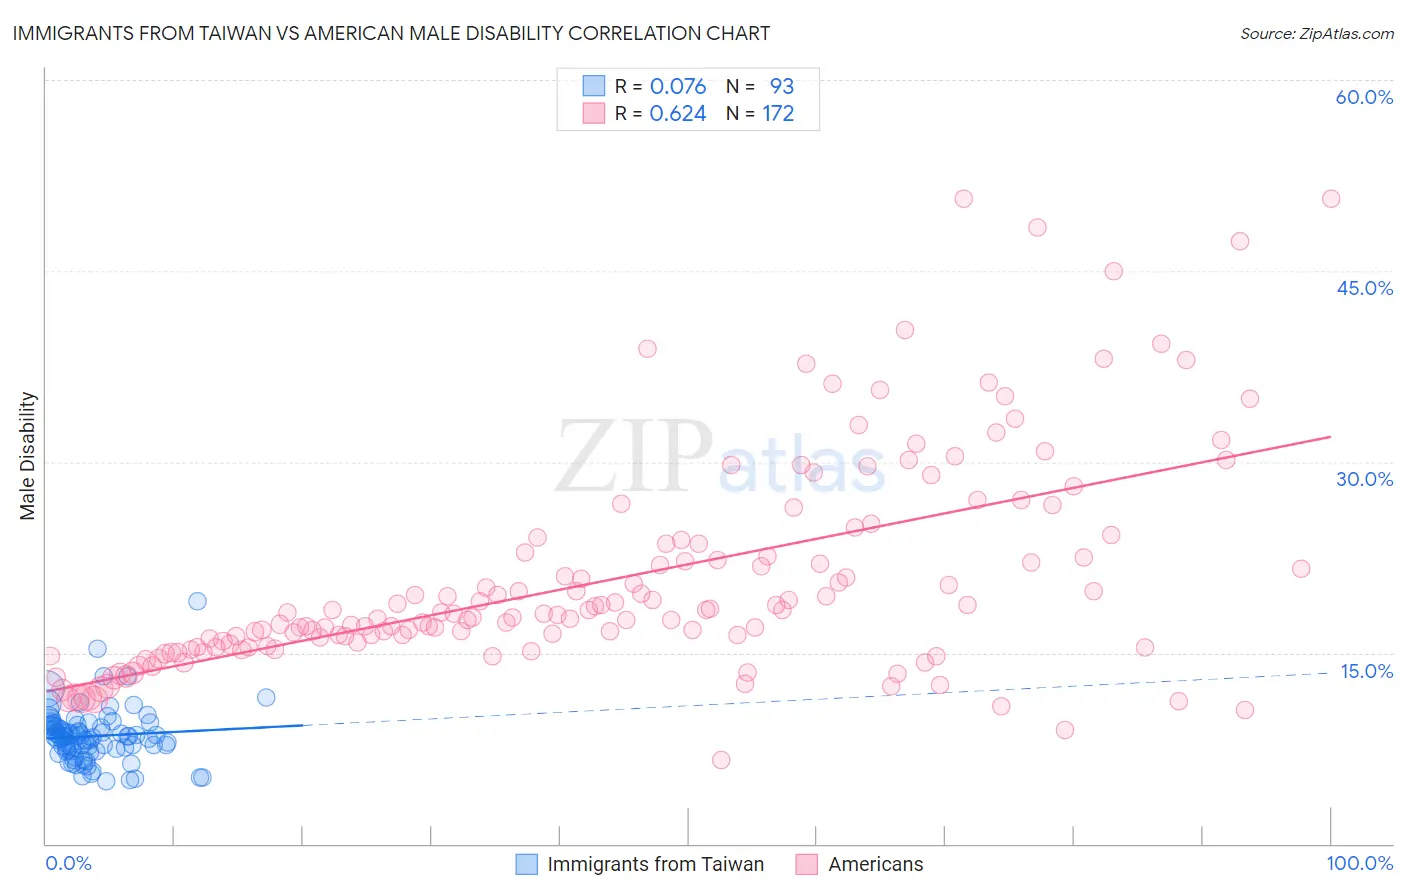
Immigrants from Taiwan vs American Male Disability Correlation Chart
The statistical analysis conducted on geographies consisting of 298,235,665 people shows a slight positive correlation between the proportion of Immigrants from Taiwan and percentage of males with a disability in the United States with a correlation coefficient (R) of 0.076 and weighted average of 9.1%. Similarly, the statistical analysis conducted on geographies consisting of 581,581,297 people shows a significant positive correlation between the proportion of Americans and percentage of males with a disability in the United States with a correlation coefficient (R) of 0.624 and weighted average of 13.8%, a difference of 51.1%.
Male Disability Correlation Summary
| Measurement | Immigrants from Taiwan | American |
| Minimum | 4.9% | 6.6% |
| Maximum | 19.0% | 50.7% |
| Range | 14.1% | 44.1% |
| Mean | 8.5% | 20.7% |
| Median | 8.4% | 18.0% |
| Interquartile 25% (IQ1) | 7.3% | 15.4% |
| Interquartile 75% (IQ3) | 9.3% | 23.2% |
| Interquartile Range (IQR) | 1.9% | 7.8% |
| Standard Deviation (Sample) | 2.1% | 8.4% |
| Standard Deviation (Population) | 2.1% | 8.4% |
Similar Demographics by Male Disability
Demographics Similar to Immigrants from Taiwan by Male Disability
In terms of male disability, the demographic groups most similar to Immigrants from Taiwan are Filipino (9.1%, a difference of 0.010%), Immigrants from India (9.0%, a difference of 0.89%), Thai (9.2%, a difference of 1.3%), Immigrants from Hong Kong (9.4%, a difference of 3.4%), and Immigrants from South Central Asia (9.4%, a difference of 3.5%).
| Demographics | Rating | Rank | Male Disability |
| Immigrants | India | 100.0 /100 | #1 | Exceptional 9.0% |
| Immigrants | Taiwan | 100.0 /100 | #2 | Exceptional 9.1% |
| Filipinos | 100.0 /100 | #3 | Exceptional 9.1% |
| Thais | 100.0 /100 | #4 | Exceptional 9.2% |
| Immigrants | Hong Kong | 100.0 /100 | #5 | Exceptional 9.4% |
| Immigrants | South Central Asia | 100.0 /100 | #6 | Exceptional 9.4% |
| Immigrants | Bolivia | 100.0 /100 | #7 | Exceptional 9.5% |
| Immigrants | China | 100.0 /100 | #8 | Exceptional 9.5% |
| Immigrants | Singapore | 100.0 /100 | #9 | Exceptional 9.5% |
| Immigrants | Israel | 100.0 /100 | #10 | Exceptional 9.6% |
| Immigrants | Eastern Asia | 100.0 /100 | #11 | Exceptional 9.6% |
| Bolivians | 100.0 /100 | #12 | Exceptional 9.6% |
| Iranians | 100.0 /100 | #13 | Exceptional 9.7% |
| Immigrants | Iran | 100.0 /100 | #14 | Exceptional 9.7% |
| Indians (Asian) | 100.0 /100 | #15 | Exceptional 9.7% |
Demographics Similar to Americans by Male Disability
In terms of male disability, the demographic groups most similar to Americans are Cree (13.7%, a difference of 0.41%), Tlingit-Haida (13.8%, a difference of 0.49%), Shoshone (13.8%, a difference of 0.54%), Paiute (13.7%, a difference of 0.62%), and Alaska Native (13.6%, a difference of 1.4%).
| Demographics | Rating | Rank | Male Disability |
| Yakama | 0.0 /100 | #312 | Tragic 13.5% |
| Puget Sound Salish | 0.0 /100 | #313 | Tragic 13.5% |
| Aleuts | 0.0 /100 | #314 | Tragic 13.5% |
| Iroquois | 0.0 /100 | #315 | Tragic 13.6% |
| Alaska Natives | 0.0 /100 | #316 | Tragic 13.6% |
| Paiute | 0.0 /100 | #317 | Tragic 13.7% |
| Cree | 0.0 /100 | #318 | Tragic 13.7% |
| Americans | 0.0 /100 | #319 | Tragic 13.8% |
| Tlingit-Haida | 0.0 /100 | #320 | Tragic 13.8% |
| Shoshone | 0.0 /100 | #321 | Tragic 13.8% |
| Apache | 0.0 /100 | #322 | Tragic 14.0% |
| Osage | 0.0 /100 | #323 | Tragic 14.0% |
| Comanche | 0.0 /100 | #324 | Tragic 14.1% |
| Ottawa | 0.0 /100 | #325 | Tragic 14.1% |
| Natives/Alaskans | 0.0 /100 | #326 | Tragic 14.2% |