Immigrants from Syria vs Lithuanian Ambulatory Disability
COMPARE
Immigrants from Syria
Lithuanian
Ambulatory Disability
Ambulatory Disability Comparison
Immigrants from Syria
Lithuanians
6.0%
AMBULATORY DISABILITY
84.1/ 100
METRIC RATING
137th/ 347
METRIC RANK
6.0%
AMBULATORY DISABILITY
81.9/ 100
METRIC RATING
149th/ 347
METRIC RANK
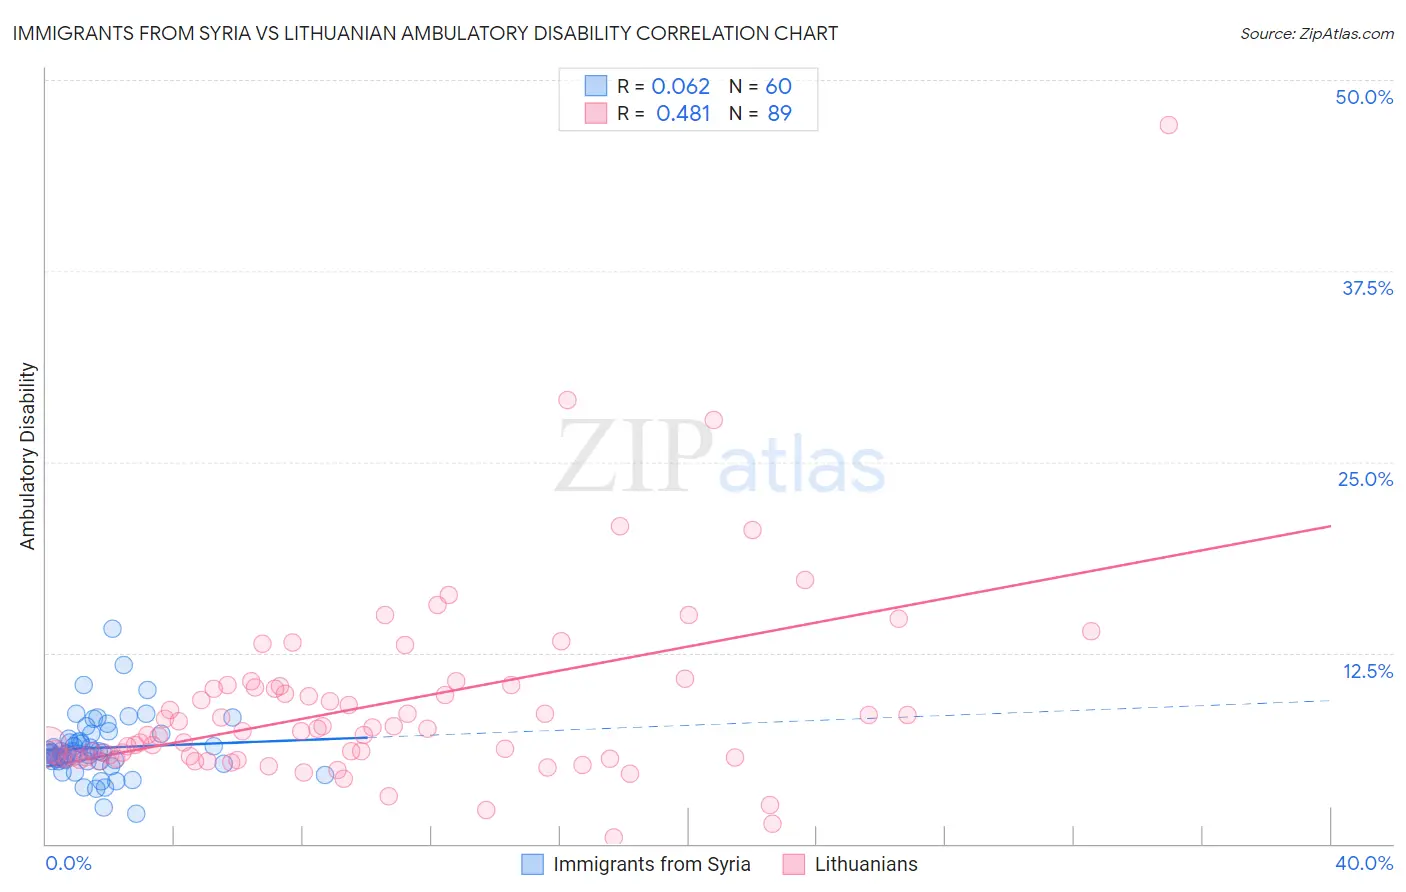
Immigrants from Syria vs Lithuanian Ambulatory Disability Correlation Chart
The statistical analysis conducted on geographies consisting of 174,106,838 people shows a slight positive correlation between the proportion of Immigrants from Syria and percentage of population with ambulatory disability in the United States with a correlation coefficient (R) of 0.062 and weighted average of 6.0%. Similarly, the statistical analysis conducted on geographies consisting of 421,829,236 people shows a moderate positive correlation between the proportion of Lithuanians and percentage of population with ambulatory disability in the United States with a correlation coefficient (R) of 0.481 and weighted average of 6.0%, a difference of 0.21%.
Ambulatory Disability Correlation Summary
| Measurement | Immigrants from Syria | Lithuanian |
| Minimum | 1.9% | 0.40% |
| Maximum | 14.1% | 47.1% |
| Range | 12.1% | 46.7% |
| Mean | 6.3% | 9.0% |
| Median | 6.0% | 7.4% |
| Interquartile 25% (IQ1) | 5.4% | 5.7% |
| Interquartile 75% (IQ3) | 7.0% | 10.3% |
| Interquartile Range (IQR) | 1.6% | 4.6% |
| Standard Deviation (Sample) | 2.0% | 6.3% |
| Standard Deviation (Population) | 2.0% | 6.3% |
Demographics Similar to Immigrants from Syria and Lithuanians by Ambulatory Disability
In terms of ambulatory disability, the demographic groups most similar to Immigrants from Syria are Immigrants from North Macedonia (6.0%, a difference of 0.0%), Immigrants from Hungary (6.0%, a difference of 0.020%), Immigrants from Zaire (6.0%, a difference of 0.050%), Czech (6.0%, a difference of 0.080%), and Immigrants from Italy (6.0%, a difference of 0.090%). Similarly, the demographic groups most similar to Lithuanians are Immigrants from Eastern Europe (6.0%, a difference of 0.010%), Maltese (6.0%, a difference of 0.020%), Immigrants from Moldova (6.0%, a difference of 0.050%), Pakistani (6.0%, a difference of 0.060%), and Immigrants from Greece (6.0%, a difference of 0.060%).
| Demographics | Rating | Rank | Ambulatory Disability |
| Immigrants | Immigrants | 86.9 /100 | #133 | Excellent 6.0% |
| Ute | 86.6 /100 | #134 | Excellent 6.0% |
| Immigrants | Italy | 85.0 /100 | #135 | Excellent 6.0% |
| Immigrants | North Macedonia | 84.1 /100 | #136 | Excellent 6.0% |
| Immigrants | Syria | 84.1 /100 | #137 | Excellent 6.0% |
| Immigrants | Hungary | 83.9 /100 | #138 | Excellent 6.0% |
| Immigrants | Zaire | 83.6 /100 | #139 | Excellent 6.0% |
| Czechs | 83.3 /100 | #140 | Excellent 6.0% |
| Swedes | 83.1 /100 | #141 | Excellent 6.0% |
| Immigrants | Philippines | 83.0 /100 | #142 | Excellent 6.0% |
| Romanians | 82.9 /100 | #143 | Excellent 6.0% |
| Macedonians | 82.8 /100 | #144 | Excellent 6.0% |
| Pakistanis | 82.5 /100 | #145 | Excellent 6.0% |
| Immigrants | Greece | 82.5 /100 | #146 | Excellent 6.0% |
| Immigrants | Moldova | 82.4 /100 | #147 | Excellent 6.0% |
| Immigrants | Eastern Europe | 82.0 /100 | #148 | Excellent 6.0% |
| Lithuanians | 81.9 /100 | #149 | Excellent 6.0% |
| Maltese | 81.6 /100 | #150 | Excellent 6.0% |
| Greeks | 79.6 /100 | #151 | Good 6.0% |
| Immigrants | Austria | 78.8 /100 | #152 | Good 6.0% |
| Syrians | 75.5 /100 | #153 | Good 6.0% |