Immigrants from Haiti vs Ugandan Hearing Disability
COMPARE
Immigrants from Haiti
Ugandan
Hearing Disability
Hearing Disability Comparison
Immigrants from Haiti
Ugandans
2.6%
HEARING DISABILITY
99.7/ 100
METRIC RATING
28th/ 347
METRIC RANK
2.9%
HEARING DISABILITY
85.5/ 100
METRIC RATING
134th/ 347
METRIC RANK
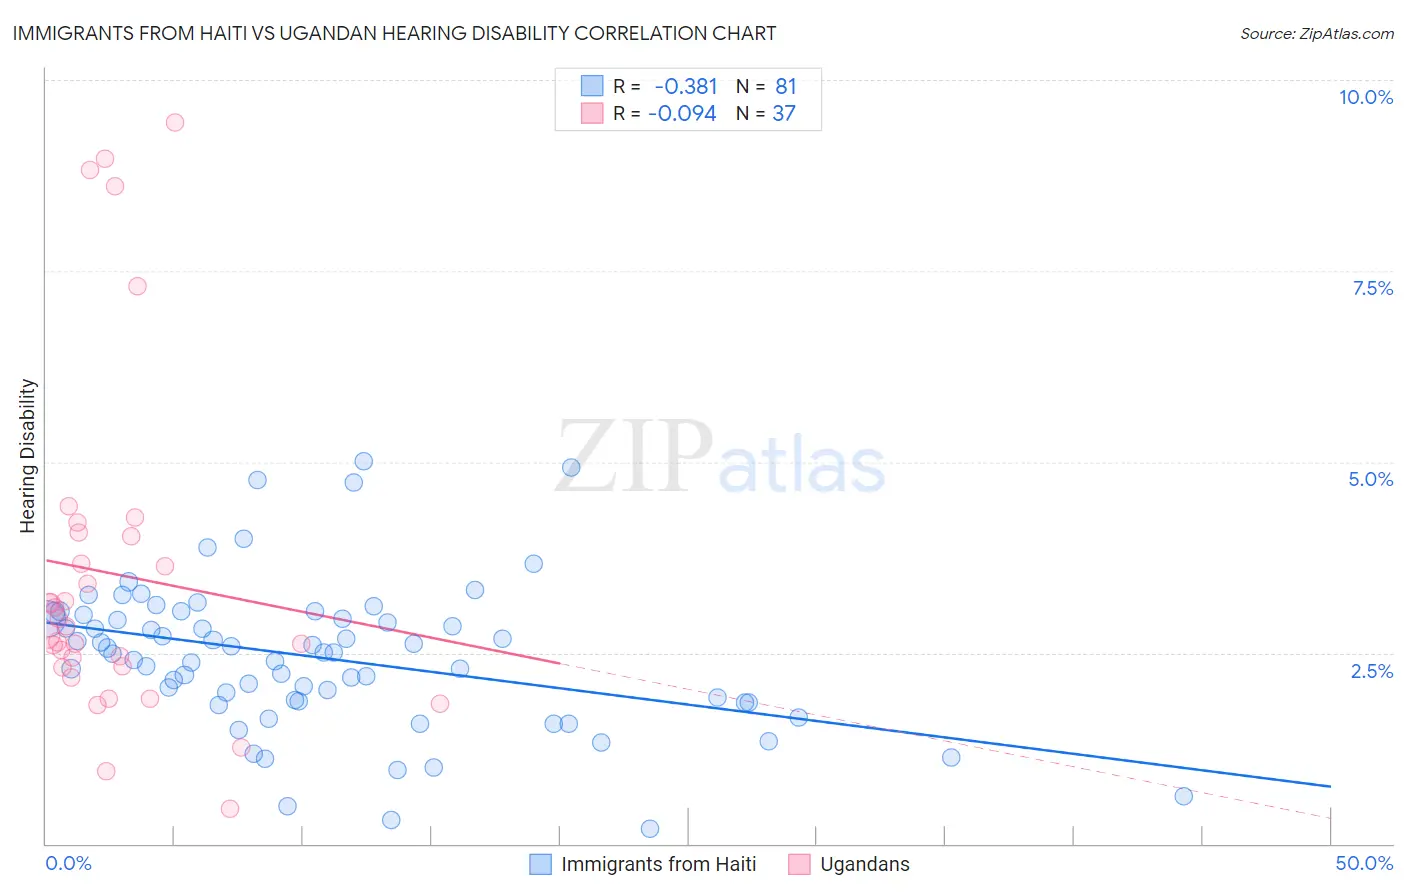
Immigrants from Haiti vs Ugandan Hearing Disability Correlation Chart
The statistical analysis conducted on geographies consisting of 225,193,212 people shows a mild negative correlation between the proportion of Immigrants from Haiti and percentage of population with hearing disability in the United States with a correlation coefficient (R) of -0.381 and weighted average of 2.6%. Similarly, the statistical analysis conducted on geographies consisting of 94,015,951 people shows a slight negative correlation between the proportion of Ugandans and percentage of population with hearing disability in the United States with a correlation coefficient (R) of -0.094 and weighted average of 2.9%, a difference of 10.8%.
Hearing Disability Correlation Summary
| Measurement | Immigrants from Haiti | Ugandan |
| Minimum | 0.20% | 0.45% |
| Maximum | 5.0% | 9.4% |
| Range | 4.8% | 9.0% |
| Mean | 2.4% | 3.5% |
| Median | 2.5% | 2.8% |
| Interquartile 25% (IQ1) | 1.9% | 2.3% |
| Interquartile 75% (IQ3) | 3.0% | 4.1% |
| Interquartile Range (IQR) | 1.1% | 1.7% |
| Standard Deviation (Sample) | 0.97% | 2.2% |
| Standard Deviation (Population) | 0.96% | 2.2% |
Similar Demographics by Hearing Disability
Demographics Similar to Immigrants from Haiti by Hearing Disability
In terms of hearing disability, the demographic groups most similar to Immigrants from Haiti are Bolivian (2.6%, a difference of 0.020%), Immigrants from Caribbean (2.6%, a difference of 0.10%), Immigrants from Cameroon (2.6%, a difference of 0.11%), Immigrants from Venezuela (2.6%, a difference of 0.26%), and Immigrants from South Central Asia (2.6%, a difference of 0.37%).
| Demographics | Rating | Rank | Hearing Disability |
| Ghanaians | 99.8 /100 | #21 | Exceptional 2.5% |
| Immigrants | Sierra Leone | 99.8 /100 | #22 | Exceptional 2.6% |
| Immigrants | Nigeria | 99.8 /100 | #23 | Exceptional 2.6% |
| Immigrants | Ghana | 99.8 /100 | #24 | Exceptional 2.6% |
| Immigrants | El Salvador | 99.7 /100 | #25 | Exceptional 2.6% |
| Immigrants | Senegal | 99.7 /100 | #26 | Exceptional 2.6% |
| Immigrants | South Central Asia | 99.7 /100 | #27 | Exceptional 2.6% |
| Immigrants | Haiti | 99.7 /100 | #28 | Exceptional 2.6% |
| Bolivians | 99.7 /100 | #29 | Exceptional 2.6% |
| Immigrants | Caribbean | 99.7 /100 | #30 | Exceptional 2.6% |
| Immigrants | Cameroon | 99.7 /100 | #31 | Exceptional 2.6% |
| Immigrants | Venezuela | 99.7 /100 | #32 | Exceptional 2.6% |
| Filipinos | 99.6 /100 | #33 | Exceptional 2.6% |
| Immigrants | Pakistan | 99.6 /100 | #34 | Exceptional 2.6% |
| Salvadorans | 99.6 /100 | #35 | Exceptional 2.6% |
Demographics Similar to Ugandans by Hearing Disability
In terms of hearing disability, the demographic groups most similar to Ugandans are Chilean (2.9%, a difference of 0.070%), Immigrants from Syria (2.9%, a difference of 0.070%), Immigrants from Kenya (2.9%, a difference of 0.13%), Soviet Union (2.9%, a difference of 0.14%), and Immigrants from Brazil (2.9%, a difference of 0.17%).
| Demographics | Rating | Rank | Hearing Disability |
| South American Indians | 86.9 /100 | #127 | Excellent 2.9% |
| Immigrants | Western Asia | 86.9 /100 | #128 | Excellent 2.9% |
| Immigrants | Uganda | 86.6 /100 | #129 | Excellent 2.9% |
| Immigrants | Vietnam | 86.5 /100 | #130 | Excellent 2.9% |
| Immigrants | Kenya | 86.1 /100 | #131 | Excellent 2.9% |
| Chileans | 85.8 /100 | #132 | Excellent 2.9% |
| Immigrants | Syria | 85.8 /100 | #133 | Excellent 2.9% |
| Ugandans | 85.5 /100 | #134 | Excellent 2.9% |
| Soviet Union | 84.8 /100 | #135 | Excellent 2.9% |
| Immigrants | Brazil | 84.6 /100 | #136 | Excellent 2.9% |
| Sri Lankans | 84.1 /100 | #137 | Excellent 2.9% |
| Immigrants | Costa Rica | 84.0 /100 | #138 | Excellent 2.9% |
| Bermudans | 83.8 /100 | #139 | Excellent 2.9% |
| Immigrants | Jordan | 83.7 /100 | #140 | Excellent 2.9% |
| Sub-Saharan Africans | 83.3 /100 | #141 | Excellent 2.9% |