British West Indian vs Ugandan Hearing Disability
COMPARE
British West Indian
Ugandan
Hearing Disability
Hearing Disability Comparison
British West Indians
Ugandans
2.4%
HEARING DISABILITY
100.0/ 100
METRIC RATING
8th/ 347
METRIC RANK
2.9%
HEARING DISABILITY
85.5/ 100
METRIC RATING
134th/ 347
METRIC RANK
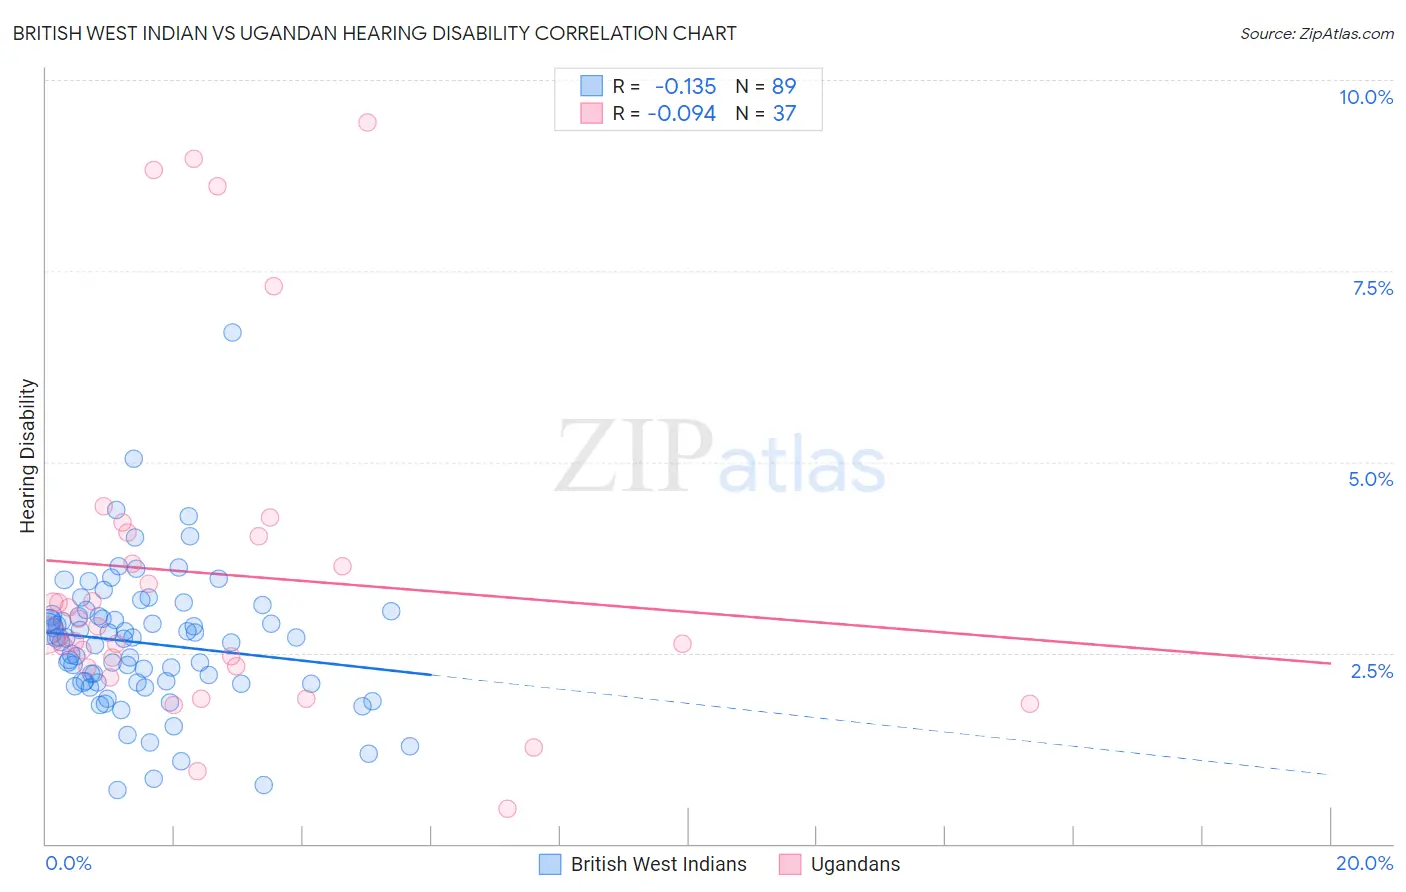
British West Indian vs Ugandan Hearing Disability Correlation Chart
The statistical analysis conducted on geographies consisting of 152,668,246 people shows a poor negative correlation between the proportion of British West Indians and percentage of population with hearing disability in the United States with a correlation coefficient (R) of -0.135 and weighted average of 2.4%. Similarly, the statistical analysis conducted on geographies consisting of 94,015,951 people shows a slight negative correlation between the proportion of Ugandans and percentage of population with hearing disability in the United States with a correlation coefficient (R) of -0.094 and weighted average of 2.9%, a difference of 18.1%.
Hearing Disability Correlation Summary
| Measurement | British West Indian | Ugandan |
| Minimum | 0.70% | 0.45% |
| Maximum | 6.7% | 9.4% |
| Range | 6.0% | 9.0% |
| Mean | 2.6% | 3.5% |
| Median | 2.7% | 2.8% |
| Interquartile 25% (IQ1) | 2.1% | 2.3% |
| Interquartile 75% (IQ3) | 3.0% | 4.1% |
| Interquartile Range (IQR) | 0.87% | 1.7% |
| Standard Deviation (Sample) | 0.90% | 2.2% |
| Standard Deviation (Population) | 0.89% | 2.2% |
Similar Demographics by Hearing Disability
Demographics Similar to British West Indians by Hearing Disability
In terms of hearing disability, the demographic groups most similar to British West Indians are Immigrants from Bangladesh (2.4%, a difference of 0.22%), Immigrants from Dominican Republic (2.4%, a difference of 0.78%), Vietnamese (2.4%, a difference of 1.8%), Immigrants from Ecuador (2.5%, a difference of 1.8%), and Immigrants from Trinidad and Tobago (2.5%, a difference of 2.4%).
| Demographics | Rating | Rank | Hearing Disability |
| Immigrants | Grenada | 100.0 /100 | #1 | Exceptional 2.2% |
| Immigrants | St. Vincent and the Grenadines | 100.0 /100 | #2 | Exceptional 2.3% |
| Guyanese | 100.0 /100 | #3 | Exceptional 2.3% |
| Immigrants | Guyana | 100.0 /100 | #4 | Exceptional 2.3% |
| Immigrants | Barbados | 100.0 /100 | #5 | Exceptional 2.4% |
| Vietnamese | 100.0 /100 | #6 | Exceptional 2.4% |
| Immigrants | Bangladesh | 100.0 /100 | #7 | Exceptional 2.4% |
| British West Indians | 100.0 /100 | #8 | Exceptional 2.4% |
| Immigrants | Dominican Republic | 100.0 /100 | #9 | Exceptional 2.4% |
| Immigrants | Ecuador | 99.9 /100 | #10 | Exceptional 2.5% |
| Immigrants | Trinidad and Tobago | 99.9 /100 | #11 | Exceptional 2.5% |
| Trinidadians and Tobagonians | 99.9 /100 | #12 | Exceptional 2.5% |
| Sierra Leoneans | 99.9 /100 | #13 | Exceptional 2.5% |
| Ecuadorians | 99.9 /100 | #14 | Exceptional 2.5% |
| Barbadians | 99.9 /100 | #15 | Exceptional 2.5% |
Demographics Similar to Ugandans by Hearing Disability
In terms of hearing disability, the demographic groups most similar to Ugandans are Chilean (2.9%, a difference of 0.070%), Immigrants from Syria (2.9%, a difference of 0.070%), Immigrants from Kenya (2.9%, a difference of 0.13%), Soviet Union (2.9%, a difference of 0.14%), and Immigrants from Brazil (2.9%, a difference of 0.17%).
| Demographics | Rating | Rank | Hearing Disability |
| South American Indians | 86.9 /100 | #127 | Excellent 2.9% |
| Immigrants | Western Asia | 86.9 /100 | #128 | Excellent 2.9% |
| Immigrants | Uganda | 86.6 /100 | #129 | Excellent 2.9% |
| Immigrants | Vietnam | 86.5 /100 | #130 | Excellent 2.9% |
| Immigrants | Kenya | 86.1 /100 | #131 | Excellent 2.9% |
| Chileans | 85.8 /100 | #132 | Excellent 2.9% |
| Immigrants | Syria | 85.8 /100 | #133 | Excellent 2.9% |
| Ugandans | 85.5 /100 | #134 | Excellent 2.9% |
| Soviet Union | 84.8 /100 | #135 | Excellent 2.9% |
| Immigrants | Brazil | 84.6 /100 | #136 | Excellent 2.9% |
| Sri Lankans | 84.1 /100 | #137 | Excellent 2.9% |
| Immigrants | Costa Rica | 84.0 /100 | #138 | Excellent 2.9% |
| Bermudans | 83.8 /100 | #139 | Excellent 2.9% |
| Immigrants | Jordan | 83.7 /100 | #140 | Excellent 2.9% |
| Sub-Saharan Africans | 83.3 /100 | #141 | Excellent 2.9% |