Immigrants from Vietnam vs Blackfeet Male Disability
COMPARE
Immigrants from Vietnam
Blackfeet
Male Disability
Male Disability Comparison
Immigrants from Vietnam
Blackfeet
10.6%
MALE DISABILITY
97.9/ 100
METRIC RATING
87th/ 347
METRIC RANK
13.4%
MALE DISABILITY
0.0/ 100
METRIC RATING
309th/ 347
METRIC RANK
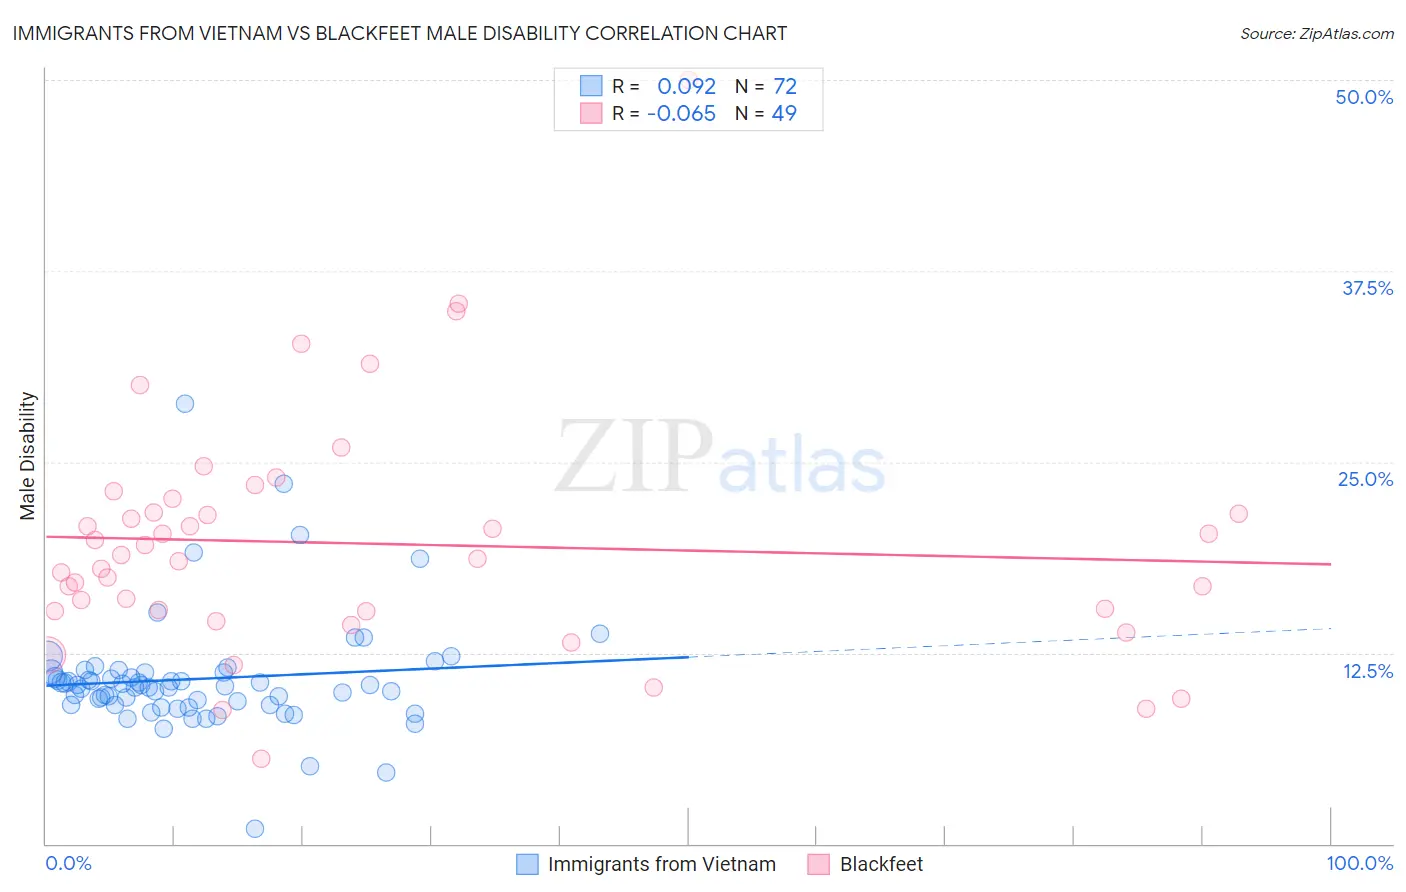
Immigrants from Vietnam vs Blackfeet Male Disability Correlation Chart
The statistical analysis conducted on geographies consisting of 404,767,194 people shows a slight positive correlation between the proportion of Immigrants from Vietnam and percentage of males with a disability in the United States with a correlation coefficient (R) of 0.092 and weighted average of 10.6%. Similarly, the statistical analysis conducted on geographies consisting of 309,505,092 people shows a slight negative correlation between the proportion of Blackfeet and percentage of males with a disability in the United States with a correlation coefficient (R) of -0.065 and weighted average of 13.4%, a difference of 26.3%.
Male Disability Correlation Summary
| Measurement | Immigrants from Vietnam | Blackfeet |
| Minimum | 0.96% | 5.6% |
| Maximum | 28.8% | 50.0% |
| Range | 27.9% | 44.4% |
| Mean | 10.8% | 19.6% |
| Median | 10.3% | 18.6% |
| Interquartile 25% (IQ1) | 9.1% | 15.2% |
| Interquartile 75% (IQ3) | 11.2% | 22.2% |
| Interquartile Range (IQR) | 2.1% | 6.9% |
| Standard Deviation (Sample) | 3.8% | 7.9% |
| Standard Deviation (Population) | 3.8% | 7.8% |
Similar Demographics by Male Disability
Demographics Similar to Immigrants from Vietnam by Male Disability
In terms of male disability, the demographic groups most similar to Immigrants from Vietnam are Immigrants from Ireland (10.6%, a difference of 0.020%), Sri Lankan (10.6%, a difference of 0.030%), Immigrants from Western Asia (10.6%, a difference of 0.070%), Immigrants from Nicaragua (10.6%, a difference of 0.070%), and Immigrants from Morocco (10.6%, a difference of 0.12%).
| Demographics | Rating | Rank | Male Disability |
| Immigrants | Jordan | 98.4 /100 | #80 | Exceptional 10.6% |
| Immigrants | Chile | 98.3 /100 | #81 | Exceptional 10.6% |
| Immigrants | Guyana | 98.2 /100 | #82 | Exceptional 10.6% |
| Immigrants | Poland | 98.1 /100 | #83 | Exceptional 10.6% |
| Bulgarians | 98.1 /100 | #84 | Exceptional 10.6% |
| Sri Lankans | 97.9 /100 | #85 | Exceptional 10.6% |
| Immigrants | Ireland | 97.9 /100 | #86 | Exceptional 10.6% |
| Immigrants | Vietnam | 97.9 /100 | #87 | Exceptional 10.6% |
| Immigrants | Western Asia | 97.8 /100 | #88 | Exceptional 10.6% |
| Immigrants | Nicaragua | 97.8 /100 | #89 | Exceptional 10.6% |
| Immigrants | Morocco | 97.7 /100 | #90 | Exceptional 10.6% |
| Immigrants | France | 97.6 /100 | #91 | Exceptional 10.6% |
| Palestinians | 97.4 /100 | #92 | Exceptional 10.7% |
| Immigrants | St. Vincent and the Grenadines | 97.1 /100 | #93 | Exceptional 10.7% |
| Immigrants | Sweden | 96.9 /100 | #94 | Exceptional 10.7% |
Demographics Similar to Blackfeet by Male Disability
In terms of male disability, the demographic groups most similar to Blackfeet are Immigrants from the Azores (13.4%, a difference of 0.14%), Delaware (13.5%, a difference of 0.33%), French American Indian (13.4%, a difference of 0.42%), Arapaho (13.3%, a difference of 0.58%), and Spanish American (13.3%, a difference of 0.80%).
| Demographics | Rating | Rank | Male Disability |
| Crow | 0.0 /100 | #302 | Tragic 13.1% |
| Scotch-Irish | 0.0 /100 | #303 | Tragic 13.2% |
| Blacks/African Americans | 0.0 /100 | #304 | Tragic 13.2% |
| French Canadians | 0.0 /100 | #305 | Tragic 13.3% |
| Spanish Americans | 0.0 /100 | #306 | Tragic 13.3% |
| Arapaho | 0.0 /100 | #307 | Tragic 13.3% |
| French American Indians | 0.0 /100 | #308 | Tragic 13.4% |
| Blackfeet | 0.0 /100 | #309 | Tragic 13.4% |
| Immigrants | Azores | 0.0 /100 | #310 | Tragic 13.4% |
| Delaware | 0.0 /100 | #311 | Tragic 13.5% |
| Yakama | 0.0 /100 | #312 | Tragic 13.5% |
| Puget Sound Salish | 0.0 /100 | #313 | Tragic 13.5% |
| Aleuts | 0.0 /100 | #314 | Tragic 13.5% |
| Iroquois | 0.0 /100 | #315 | Tragic 13.6% |
| Alaska Natives | 0.0 /100 | #316 | Tragic 13.6% |