Immigrants from St. Vincent and the Grenadines vs Potawatomi Female Disability
COMPARE
Immigrants from St. Vincent and the Grenadines
Potawatomi
Female Disability
Female Disability Comparison
Immigrants from St. Vincent and the Grenadines
Potawatomi
12.2%
FEMALE DISABILITY
49.7/ 100
METRIC RATING
175th/ 347
METRIC RANK
14.1%
FEMALE DISABILITY
0.0/ 100
METRIC RATING
321st/ 347
METRIC RANK
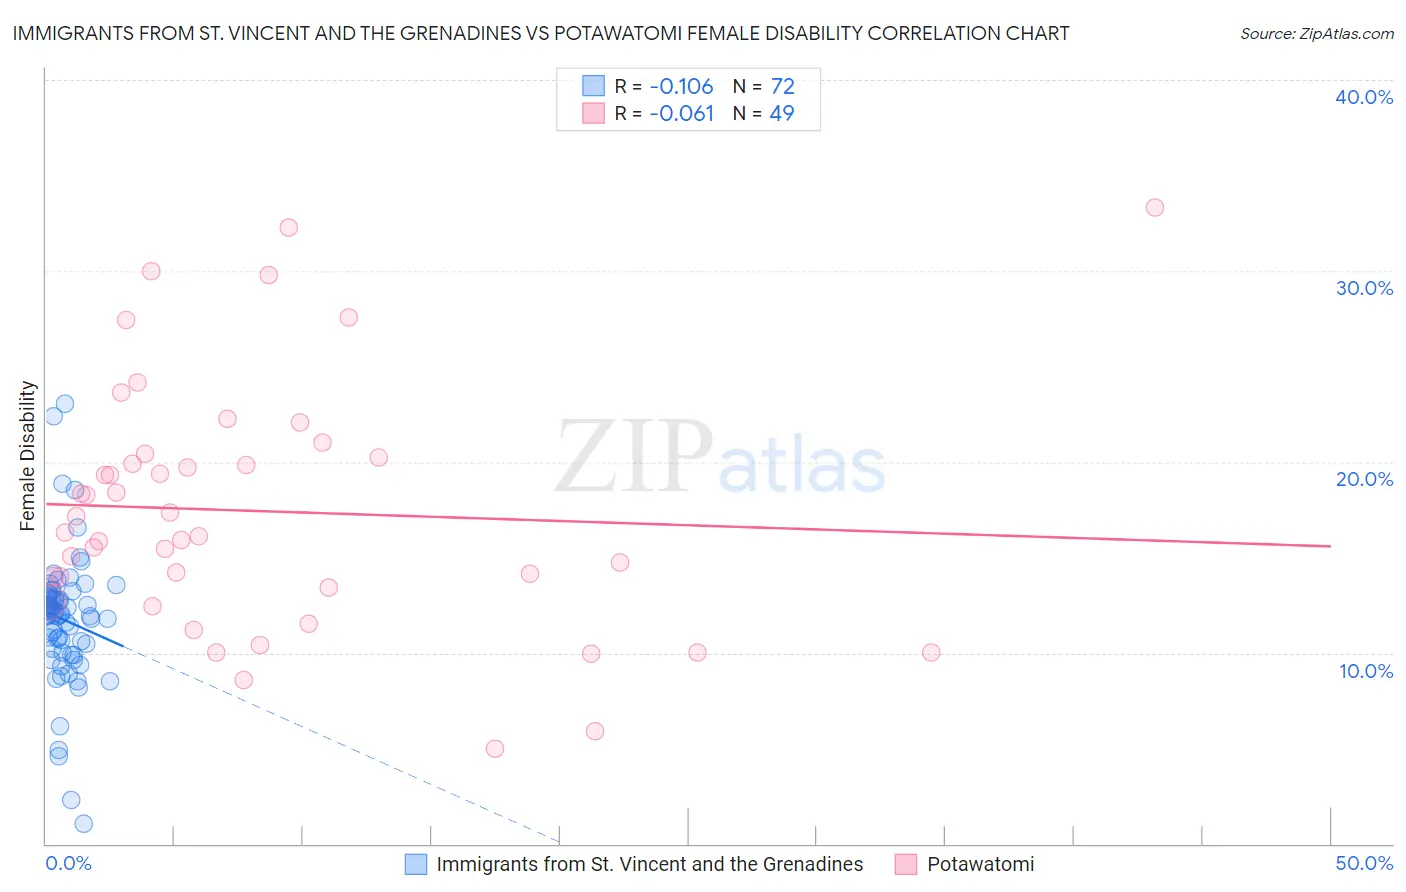
Immigrants from St. Vincent and the Grenadines vs Potawatomi Female Disability Correlation Chart
The statistical analysis conducted on geographies consisting of 56,175,072 people shows a poor negative correlation between the proportion of Immigrants from St. Vincent and the Grenadines and percentage of females with a disability in the United States with a correlation coefficient (R) of -0.106 and weighted average of 12.2%. Similarly, the statistical analysis conducted on geographies consisting of 117,767,381 people shows a slight negative correlation between the proportion of Potawatomi and percentage of females with a disability in the United States with a correlation coefficient (R) of -0.061 and weighted average of 14.1%, a difference of 15.7%.
Female Disability Correlation Summary
| Measurement | Immigrants from St. Vincent and the Grenadines | Potawatomi |
| Minimum | 1.1% | 5.0% |
| Maximum | 23.1% | 33.3% |
| Range | 22.0% | 28.3% |
| Mean | 11.7% | 17.4% |
| Median | 12.0% | 16.3% |
| Interquartile 25% (IQ1) | 10.1% | 13.0% |
| Interquartile 75% (IQ3) | 12.9% | 20.3% |
| Interquartile Range (IQR) | 2.8% | 7.3% |
| Standard Deviation (Sample) | 3.5% | 6.5% |
| Standard Deviation (Population) | 3.5% | 6.4% |
Similar Demographics by Female Disability
Demographics Similar to Immigrants from St. Vincent and the Grenadines by Female Disability
In terms of female disability, the demographic groups most similar to Immigrants from St. Vincent and the Grenadines are Immigrants from England (12.2%, a difference of 0.010%), Immigrants from Mexico (12.2%, a difference of 0.040%), Haitian (12.2%, a difference of 0.080%), Immigrants from Southern Europe (12.2%, a difference of 0.25%), and Immigrants from Guyana (12.2%, a difference of 0.25%).
| Demographics | Rating | Rank | Female Disability |
| Immigrants | Haiti | 58.8 /100 | #168 | Average 12.2% |
| Lebanese | 58.1 /100 | #169 | Average 12.2% |
| Maltese | 57.0 /100 | #170 | Average 12.2% |
| Immigrants | Southern Europe | 56.3 /100 | #171 | Average 12.2% |
| Haitians | 51.9 /100 | #172 | Average 12.2% |
| Immigrants | Mexico | 50.8 /100 | #173 | Average 12.2% |
| Immigrants | England | 50.0 /100 | #174 | Average 12.2% |
| Immigrants | St. Vincent and the Grenadines | 49.7 /100 | #175 | Average 12.2% |
| Immigrants | Guyana | 43.1 /100 | #176 | Average 12.2% |
| Immigrants | Ghana | 42.5 /100 | #177 | Average 12.2% |
| Immigrants | Western Europe | 40.9 /100 | #178 | Average 12.2% |
| Immigrants | Fiji | 38.2 /100 | #179 | Fair 12.3% |
| Albanians | 37.9 /100 | #180 | Fair 12.3% |
| Immigrants | Canada | 37.2 /100 | #181 | Fair 12.3% |
| Norwegians | 36.9 /100 | #182 | Fair 12.3% |
Demographics Similar to Potawatomi by Female Disability
In terms of female disability, the demographic groups most similar to Potawatomi are Pueblo (14.1%, a difference of 0.010%), American (14.1%, a difference of 0.14%), Black/African American (14.1%, a difference of 0.18%), Native/Alaskan (14.1%, a difference of 0.20%), and Navajo (14.2%, a difference of 0.33%).
| Demographics | Rating | Rank | Female Disability |
| Puget Sound Salish | 0.0 /100 | #314 | Tragic 13.8% |
| Alaskan Athabascans | 0.0 /100 | #315 | Tragic 13.9% |
| Spanish Americans | 0.0 /100 | #316 | Tragic 14.0% |
| Chippewa | 0.0 /100 | #317 | Tragic 14.0% |
| Paiute | 0.0 /100 | #318 | Tragic 14.0% |
| Iroquois | 0.0 /100 | #319 | Tragic 14.0% |
| Americans | 0.0 /100 | #320 | Tragic 14.1% |
| Potawatomi | 0.0 /100 | #321 | Tragic 14.1% |
| Pueblo | 0.0 /100 | #322 | Tragic 14.1% |
| Blacks/African Americans | 0.0 /100 | #323 | Tragic 14.1% |
| Natives/Alaskans | 0.0 /100 | #324 | Tragic 14.1% |
| Navajo | 0.0 /100 | #325 | Tragic 14.2% |
| Comanche | 0.0 /100 | #326 | Tragic 14.2% |
| Ottawa | 0.0 /100 | #327 | Tragic 14.2% |
| Cape Verdeans | 0.0 /100 | #328 | Tragic 14.2% |