Immigrants from Sri Lanka vs Iroquois Disability Age 65 to 74

COMPARE

Immigrants from Sri Lanka
Race
Ancestry
AfghanAfricanAlaska NativeAlaskan AthabascanAlbanianAleutAlsatianAmericanApacheArabArapahoArgentineanArmenianAssyrian/Chaldean/SyriacAustralianAustrianBahamianBangladeshiBarbadianBasqueBelgianBelizeanBermudanBhutaneseBlackfeetBolivianBrazilianBritishBritish West IndianBulgarianBurmeseCajunCambodianCanadianCape VerdeanCarpatho RusynCelticCentral AmericanCentral American IndianCherokeeCheyenneChickasawChileanChineseChippewaChoctawColombianColvilleComancheCosta RicanCreeCreekCroatianCrowCubanCypriotCzechCzechoslovakianDanishDelawareDominicanDutchDutch West IndianEastern EuropeanEcuadorianEgyptianEnglishEstonianEthiopianEuropeanFijianFilipinoFinnishFrenchFrench American IndianFrench CanadianGermanGerman RussianGhanaianGreekGuamanian/ChamorroGuatemalanGuyaneseHaitianHmongHonduranHopiHoumaHungarianIcelanderIndian (Asian)IndonesianInupiatIranianIraqiIrishIsraeliItalianJamaicanJapaneseJordanianKenyanKiowaKoreanLaotianLatvianLebaneseLiberianLithuanianLumbeeLuxembourgerMacedonianMalaysianMalteseMarshalleseMenomineeMexicanMexican American IndianMongolianMoroccanNative HawaiianNavajoNepaleseNew ZealanderNicaraguanNigerianNorthern EuropeanNorwegianOkinawanOsageOttawaPaiutePakistaniPalestinianPanamanianParaguayanPennsylvania GermanPeruvianPimaPolishPortuguesePotawatomiPuebloPuerto RicanPuget Sound SalishRomanianRussianSalvadoranSamoanScandinavianScotch-IrishScottishSeminoleSenegaleseSerbianShoshoneSierra LeoneanSiouxSlavicSlovakSloveneSomaliSouth AfricanSouth AmericanSouth American IndianSoviet UnionSpaniardSpanishSpanish AmericanSpanish American IndianSri LankanSubsaharan AfricanSudaneseSwedishSwissSyrianTaiwaneseThaiTlingit-HaidaTohono O'OdhamTonganTrinidadian and TobagonianTsimshianTurkishU.S. Virgin IslanderUgandanUkrainianUruguayanUteVenezuelanVietnameseWelshWest IndianYakamaYaquiYugoslavianYumanYup'ikZimbabwean
Immigration
NonimmigrantsImmigrantsAfghanistanAfricaAlbaniaArgentinaArmeniaAsiaAustraliaAustriaBahamasBangladeshBarbadosBelarusBelgiumBelizeBoliviaBosnia and HerzegovinaBrazilBulgariaBurma/MyanmarCabo VerdeCambodiaCameroonCanadaCaribbeanCentral AmericaChileChinaColombiaCongoCosta RicaCroatiaCubaCzechoslovakiaDenmarkDominicaDominican RepublicEastern AfricaEastern AsiaEastern EuropeEcuadorEgyptEl SalvadorEnglandEritreaEthiopiaEuropeFijiFranceGermanyGhanaGreeceGrenadaGuatemalaGuyanaHaitiHondurasHong KongHungaryIndiaIndonesiaIranIraqIrelandIsraelItalyJamaicaJapanJordanKazakhstanKenyaKoreaKuwaitLaosLatin AmericaLatviaLebanonLiberiaLithuaniaMalaysiaMexicoMicronesiaMiddle AfricaMoldovaMoroccoNepalNetherlandsNicaraguaNigeriaNorth AmericaNorth MacedoniaNorthern AfricaNorthern EuropeNorwayOceaniaPakistanPanamaPeruPhilippinesPolandPortugalRomaniaRussiaSaudi ArabiaScotlandSenegalSerbiaSierra LeoneSingaporeSomaliaSouth AfricaSouth AmericaSouth Central AsiaSouth Eastern AsiaSouthern EuropeSpainSri LankaSt. Vincent and the GrenadinesSudanSwedenSwitzerlandSyriaTaiwanThailandTrinidad and TobagoTurkeyUgandaUkraineUruguayUzbekistanVenezuelaVietnamWest IndiesWestern AfricaWestern AsiaWestern EuropeYemenZaireZimbabweAzores
Iroquois
Race
Ancestry
AfghanAfricanAlaska NativeAlaskan AthabascanAlbanianAleutAlsatianAmericanApacheArabArapahoArgentineanArmenianAssyrian/Chaldean/SyriacAustralianAustrianBahamianBangladeshiBarbadianBasqueBelgianBelizeanBermudanBhutaneseBlackfeetBolivianBrazilianBritishBritish West IndianBulgarianBurmeseCajunCambodianCanadianCape VerdeanCarpatho RusynCelticCentral AmericanCentral American IndianCherokeeCheyenneChickasawChileanChineseChippewaChoctawColombianColvilleComancheCosta RicanCreeCreekCroatianCrowCubanCypriotCzechCzechoslovakianDanishDelawareDominicanDutchDutch West IndianEastern EuropeanEcuadorianEgyptianEnglishEstonianEthiopianEuropeanFijianFilipinoFinnishFrenchFrench American IndianFrench CanadianGermanGerman RussianGhanaianGreekGuamanian/ChamorroGuatemalanGuyaneseHaitianHmongHonduranHopiHoumaHungarianIcelanderIndian (Asian)IndonesianInupiatIranianIraqiIrishIroquoisIsraeliItalianJamaicanJapaneseJordanianKenyanKiowaKoreanLaotianLatvianLebaneseLiberianLithuanianLumbeeLuxembourgerMacedonianMalaysianMalteseMarshalleseMenomineeMexicanMexican American IndianMongolianMoroccanNative HawaiianNavajoNepaleseNew ZealanderNicaraguanNigerianNorthern EuropeanNorwegianOkinawanOsageOttawaPaiutePakistaniPalestinianPanamanianParaguayanPennsylvania GermanPeruvianPimaPolishPortuguesePotawatomiPuebloPuerto RicanPuget Sound SalishRomanianRussianSalvadoranSamoanScandinavianScotch-IrishScottishSeminoleSenegaleseSerbianShoshoneSierra LeoneanSiouxSlavicSlovakSloveneSomaliSouth AfricanSouth AmericanSouth American IndianSoviet UnionSpaniardSpanishSpanish AmericanSpanish American IndianSri LankanSubsaharan AfricanSudaneseSwedishSwissSyrianTaiwaneseThaiTlingit-HaidaTohono O'OdhamTonganTrinidadian and TobagonianTsimshianTurkishU.S. Virgin IslanderUgandanUkrainianUruguayanUteVenezuelanVietnameseWelshWest IndianYakamaYaquiYugoslavianYumanYup'ikZimbabwean
Immigration
NonimmigrantsImmigrantsAfghanistanAfricaAlbaniaArgentinaArmeniaAsiaAustraliaAustriaBahamasBangladeshBarbadosBelarusBelgiumBelizeBoliviaBosnia and HerzegovinaBrazilBulgariaBurma/MyanmarCabo VerdeCambodiaCameroonCanadaCaribbeanCentral AmericaChileChinaColombiaCongoCosta RicaCroatiaCubaCzechoslovakiaDenmarkDominicaDominican RepublicEastern AfricaEastern AsiaEastern EuropeEcuadorEgyptEl SalvadorEnglandEritreaEthiopiaEuropeFijiFranceGermanyGhanaGreeceGrenadaGuatemalaGuyanaHaitiHondurasHong KongHungaryIndiaIndonesiaIranIraqIrelandIsraelItalyJamaicaJapanJordanKazakhstanKenyaKoreaKuwaitLaosLatin AmericaLatviaLebanonLiberiaLithuaniaMalaysiaMexicoMicronesiaMiddle AfricaMoldovaMoroccoNepalNetherlandsNicaraguaNigeriaNorth AmericaNorth MacedoniaNorthern AfricaNorthern EuropeNorwayOceaniaPakistanPanamaPeruPhilippinesPolandPortugalRomaniaRussiaSaudi ArabiaScotlandSenegalSerbiaSierra LeoneSingaporeSomaliaSouth AfricaSouth AmericaSouth Central AsiaSouth Eastern AsiaSouthern EuropeSpainSt. Vincent and the GrenadinesSudanSwedenSwitzerlandSyriaTaiwanThailandTrinidad and TobagoTurkeyUgandaUkraineUruguayUzbekistanVenezuelaVietnamWest IndiesWestern AfricaWestern AsiaWestern EuropeYemenZaireZimbabweAzores
Disability Age 65 to 74
Income
Poverty
Unemployment
Labor Participation
Family Structure
Vehicle Availability
Education Level
Disability

Disability Age 65 to 74 Comparison

Immigrants from Sri Lanka

Iroquois

Exceptional
Tragic
21.1%
DISABILITY AGE 65 TO 74
99.9/ 100
METRIC RATING
34th/ 347
METRIC RANK
25.4%
DISABILITY AGE 65 TO 74
0.2/ 100
METRIC RATING
263rd/ 347
METRIC RANK

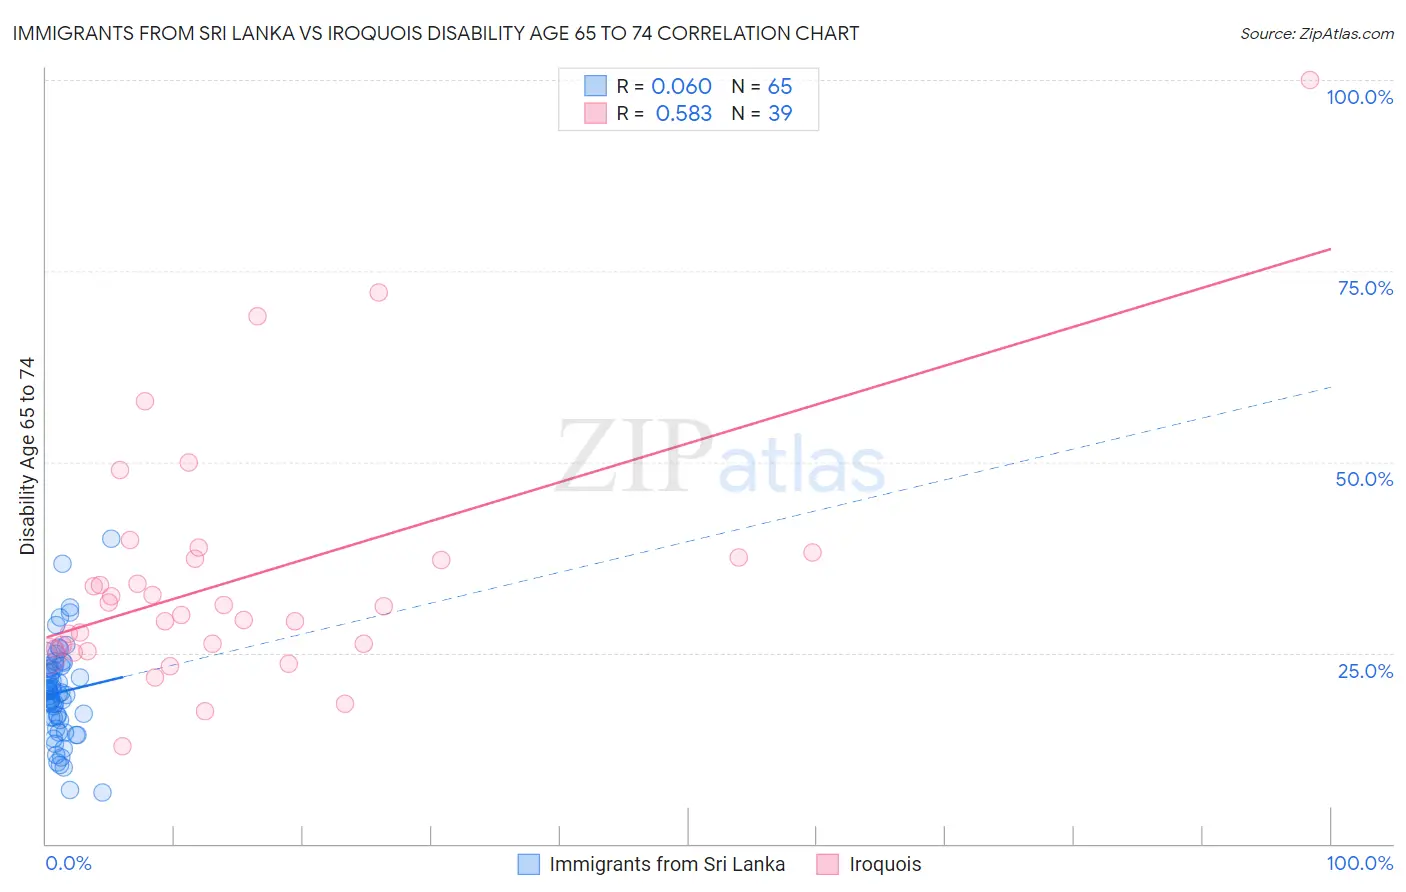
Immigrants from Sri Lanka vs Iroquois Disability Age 65 to 74 Correlation Chart

The statistical analysis conducted on geographies consisting of 149,658,794 people shows a slight positive correlation between the proportion of Immigrants from Sri Lanka and percentage of population with a disability between the ages 65 and 75 in the United States with a correlation coefficient (R) of 0.060 and weighted average of 21.1%. Similarly, the statistical analysis conducted on geographies consisting of 207,066,685 people shows a substantial positive correlation between the proportion of Iroquois and percentage of population with a disability between the ages 65 and 75 in the United States with a correlation coefficient (R) of 0.583 and weighted average of 25.4%, a difference of 20.7%.
Immigrants from Sri Lanka vs Iroquois Disability Age 65 to 74

Disability Age 65 to 74 Correlation Summary

MeasurementImmigrants from Sri LankaIroquois
Minimum6.7%12.8%
Maximum39.9%100.0%
Range33.1%87.2%
Mean19.8%34.8%
Median19.8%31.1%
Interquartile 25% (IQ1)16.3%25.6%
Interquartile 75% (IQ3)23.1%37.6%
Interquartile Range (IQR)6.8%12.0%
Standard Deviation (Sample)6.2%16.4%
Standard Deviation (Population)6.2%16.2%

Similar Demographics by Disability Age 65 to 74

Demographics Similar to Immigrants from Sri Lanka by Disability Age 65 to 74

In terms of disability age 65 to 74, the demographic groups most similar to Immigrants from Sri Lanka are Immigrants from Argentina (21.1%, a difference of 0.030%), Bulgarian (21.1%, a difference of 0.050%), Turkish (21.0%, a difference of 0.23%), Immigrants from Switzerland (21.1%, a difference of 0.25%), and Immigrants from Northern Europe (21.0%, a difference of 0.27%).
DemographicsRating | RankDisability Age 65 to 74
Immigrants | Sweden
99.9
/100
|
#27
Exceptional
21.0%
Immigrants | Czechoslovakia
99.9
/100
|
#28
Exceptional
21.0%
Immigrants | Japan
99.9
/100
|
#29
Exceptional
21.0%
Immigrants | Greece
99.9
/100
|
#30
Exceptional
21.0%
Immigrants | Northern Europe
99.9
/100
|
#31
Exceptional
21.0%
Turks
99.9
/100
|
#32
Exceptional
21.0%
Immigrants | Argentina
99.9
/100
|
#33
Exceptional
21.1%
Immigrants | Sri Lanka
99.9
/100
|
#34
Exceptional
21.1%
Bulgarians
99.9
/100
|
#35
Exceptional
21.1%
Immigrants | Switzerland
99.8
/100
|
#36
Exceptional
21.1%
Israelis
99.8
/100
|
#37
Exceptional
21.2%
Russians
99.8
/100
|
#38
Exceptional
21.2%
Argentineans
99.8
/100
|
#39
Exceptional
21.2%
Latvians
99.8
/100
|
#40
Exceptional
21.2%
Immigrants | Austria
99.8
/100
|
#41
Exceptional
21.2%

Demographics Similar to Iroquois by Disability Age 65 to 74

In terms of disability age 65 to 74, the demographic groups most similar to Iroquois are Samoan (25.4%, a difference of 0.010%), Cape Verdean (25.4%, a difference of 0.10%), Malaysian (25.4%, a difference of 0.18%), Hawaiian (25.5%, a difference of 0.34%), and Guatemalan (25.5%, a difference of 0.39%).
DemographicsRating | RankDisability Age 65 to 74
Immigrants | Somalia
0.4
/100
|
#256
Tragic
25.2%
Guamanians/Chamorros
0.3
/100
|
#257
Tragic
25.3%
Marshallese
0.3
/100
|
#258
Tragic
25.3%
Immigrants | Cambodia
0.3
/100
|
#259
Tragic
25.3%
Malaysians
0.2
/100
|
#260
Tragic
25.4%
Cape Verdeans
0.2
/100
|
#261
Tragic
25.4%
Samoans
0.2
/100
|
#262
Tragic
25.4%
Iroquois
0.2
/100
|
#263
Tragic
25.4%
Hawaiians
0.2
/100
|
#264
Tragic
25.5%
Guatemalans
0.2
/100
|
#265
Tragic
25.5%
Immigrants | Latin America
0.1
/100
|
#266
Tragic
25.6%
Ottawa
0.1
/100
|
#267
Tragic
25.6%
Liberians
0.1
/100
|
#268
Tragic
25.6%
Hmong
0.1
/100
|
#269
Tragic
25.7%
Immigrants | Guatemala
0.1
/100
|
#270
Tragic
25.7%