Immigrants from Sri Lanka vs Indian (Asian) Disability Age 65 to 74
COMPARE
Immigrants from Sri Lanka
Indian (Asian)
Disability Age 65 to 74
Disability Age 65 to 74 Comparison
Immigrants from Sri Lanka
Indians (Asian)
21.1%
DISABILITY AGE 65 TO 74
99.9/ 100
METRIC RATING
34th/ 347
METRIC RANK
20.5%
DISABILITY AGE 65 TO 74
100.0/ 100
METRIC RATING
14th/ 347
METRIC RANK
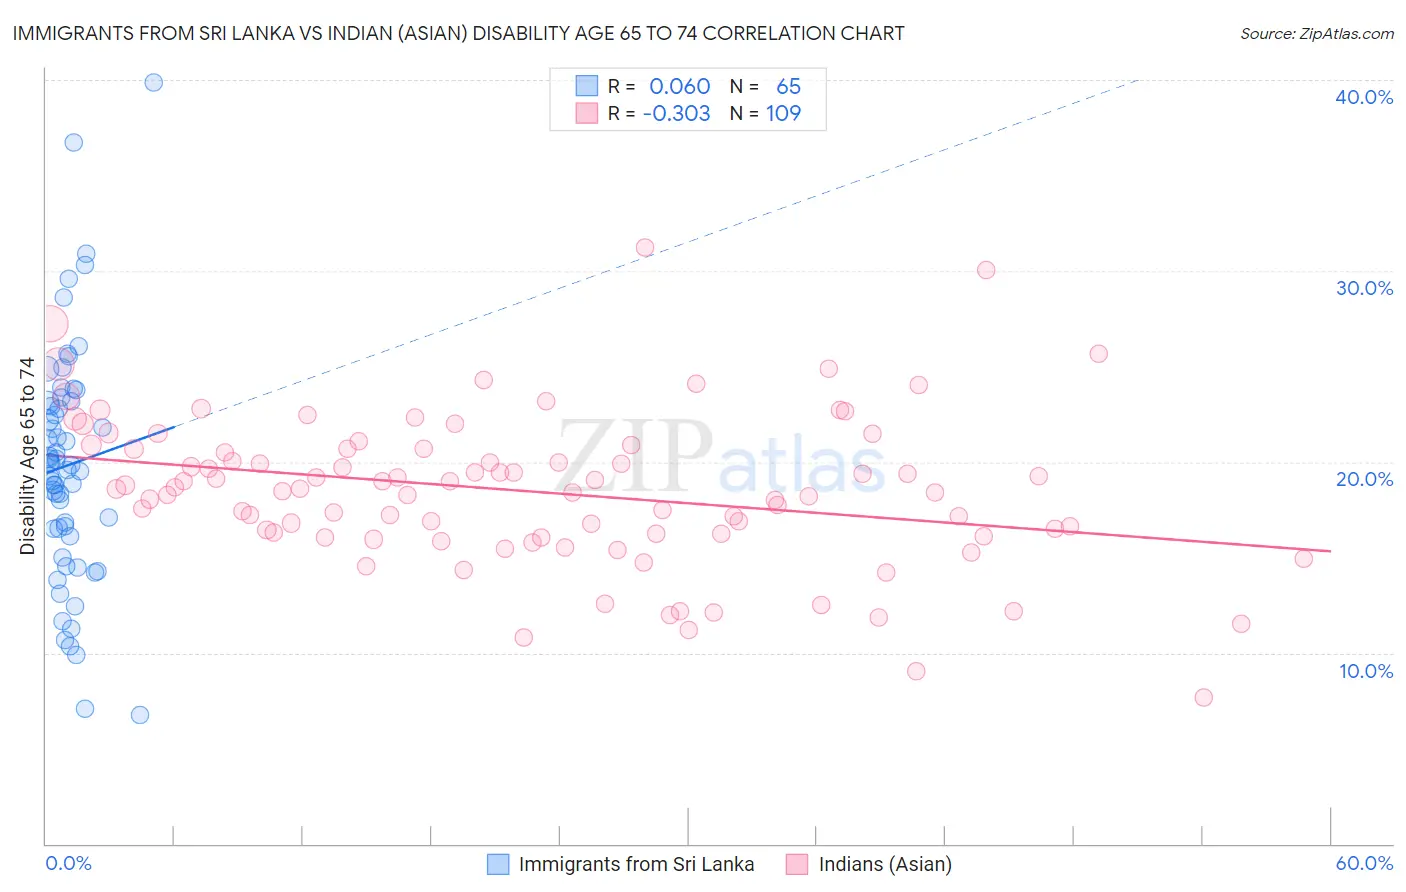
Immigrants from Sri Lanka vs Indian (Asian) Disability Age 65 to 74 Correlation Chart
The statistical analysis conducted on geographies consisting of 149,658,794 people shows a slight positive correlation between the proportion of Immigrants from Sri Lanka and percentage of population with a disability between the ages 65 and 75 in the United States with a correlation coefficient (R) of 0.060 and weighted average of 21.1%. Similarly, the statistical analysis conducted on geographies consisting of 493,721,997 people shows a mild negative correlation between the proportion of Indians (Asian) and percentage of population with a disability between the ages 65 and 75 in the United States with a correlation coefficient (R) of -0.303 and weighted average of 20.5%, a difference of 2.7%.
Disability Age 65 to 74 Correlation Summary
| Measurement | Immigrants from Sri Lanka | Indian (Asian) |
| Minimum | 6.7% | 7.7% |
| Maximum | 39.9% | 31.2% |
| Range | 33.1% | 23.6% |
| Mean | 19.8% | 18.5% |
| Median | 19.8% | 18.6% |
| Interquartile 25% (IQ1) | 16.3% | 16.1% |
| Interquartile 75% (IQ3) | 23.1% | 20.7% |
| Interquartile Range (IQR) | 6.8% | 4.5% |
| Standard Deviation (Sample) | 6.2% | 4.0% |
| Standard Deviation (Population) | 6.2% | 4.0% |
Demographics Similar to Immigrants from Sri Lanka and Indians (Asian) by Disability Age 65 to 74
In terms of disability age 65 to 74, the demographic groups most similar to Immigrants from Sri Lanka are Immigrants from Argentina (21.1%, a difference of 0.030%), Turkish (21.0%, a difference of 0.23%), Immigrants from Northern Europe (21.0%, a difference of 0.27%), Immigrants from Greece (21.0%, a difference of 0.31%), and Immigrants from Japan (21.0%, a difference of 0.34%). Similarly, the demographic groups most similar to Indians (Asian) are Paraguayan (20.5%, a difference of 0.020%), Immigrants from Lithuania (20.5%, a difference of 0.080%), Immigrants from South Central Asia (20.6%, a difference of 0.33%), Eastern European (20.6%, a difference of 0.40%), and Burmese (20.6%, a difference of 0.43%).
| Demographics | Rating | Rank | Disability Age 65 to 74 |
| Indians (Asian) | 100.0 /100 | #14 | Exceptional 20.5% |
| Paraguayans | 100.0 /100 | #15 | Exceptional 20.5% |
| Immigrants | Lithuania | 100.0 /100 | #16 | Exceptional 20.5% |
| Immigrants | South Central Asia | 100.0 /100 | #17 | Exceptional 20.6% |
| Eastern Europeans | 100.0 /100 | #18 | Exceptional 20.6% |
| Burmese | 100.0 /100 | #19 | Exceptional 20.6% |
| Okinawans | 100.0 /100 | #20 | Exceptional 20.7% |
| Immigrants | Bolivia | 99.9 /100 | #21 | Exceptional 20.8% |
| Immigrants | Iran | 99.9 /100 | #22 | Exceptional 20.9% |
| Immigrants | Belgium | 99.9 /100 | #23 | Exceptional 21.0% |
| Soviet Union | 99.9 /100 | #24 | Exceptional 21.0% |
| Bolivians | 99.9 /100 | #25 | Exceptional 21.0% |
| Immigrants | Australia | 99.9 /100 | #26 | Exceptional 21.0% |
| Immigrants | Sweden | 99.9 /100 | #27 | Exceptional 21.0% |
| Immigrants | Czechoslovakia | 99.9 /100 | #28 | Exceptional 21.0% |
| Immigrants | Japan | 99.9 /100 | #29 | Exceptional 21.0% |
| Immigrants | Greece | 99.9 /100 | #30 | Exceptional 21.0% |
| Immigrants | Northern Europe | 99.9 /100 | #31 | Exceptional 21.0% |
| Turks | 99.9 /100 | #32 | Exceptional 21.0% |
| Immigrants | Argentina | 99.9 /100 | #33 | Exceptional 21.1% |
| Immigrants | Sri Lanka | 99.9 /100 | #34 | Exceptional 21.1% |