Immigrants from Sri Lanka vs Paiute Disability Age 65 to 74
COMPARE
Immigrants from Sri Lanka
Paiute
Disability Age 65 to 74
Disability Age 65 to 74 Comparison
Immigrants from Sri Lanka
Paiute
21.1%
DISABILITY AGE 65 TO 74
99.9/ 100
METRIC RATING
34th/ 347
METRIC RANK
27.8%
DISABILITY AGE 65 TO 74
0.0/ 100
METRIC RATING
313th/ 347
METRIC RANK
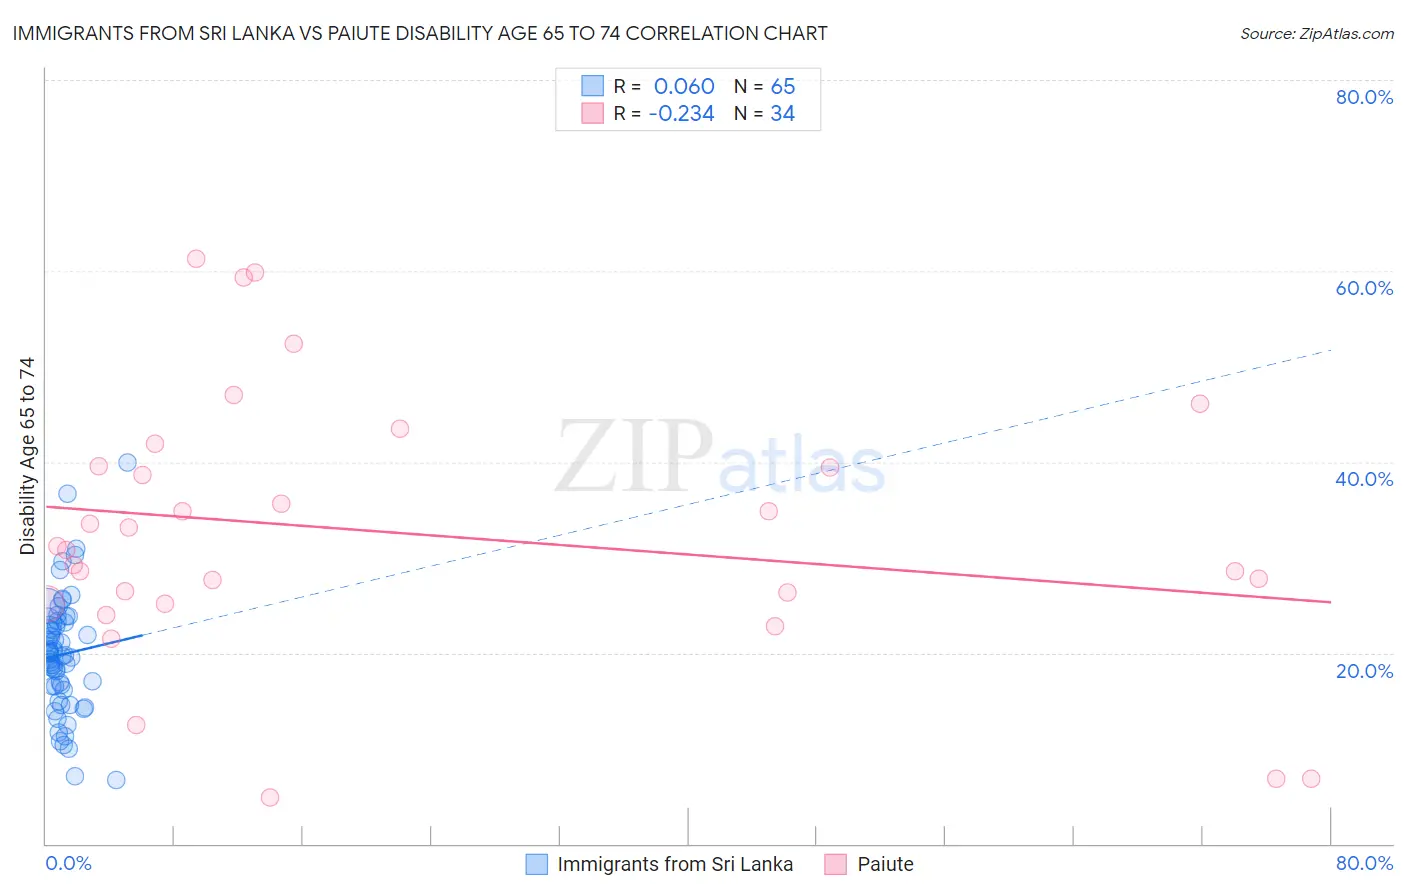
Immigrants from Sri Lanka vs Paiute Disability Age 65 to 74 Correlation Chart
The statistical analysis conducted on geographies consisting of 149,658,794 people shows a slight positive correlation between the proportion of Immigrants from Sri Lanka and percentage of population with a disability between the ages 65 and 75 in the United States with a correlation coefficient (R) of 0.060 and weighted average of 21.1%. Similarly, the statistical analysis conducted on geographies consisting of 58,387,848 people shows a weak negative correlation between the proportion of Paiute and percentage of population with a disability between the ages 65 and 75 in the United States with a correlation coefficient (R) of -0.234 and weighted average of 27.8%, a difference of 31.9%.
Disability Age 65 to 74 Correlation Summary
| Measurement | Immigrants from Sri Lanka | Paiute |
| Minimum | 6.7% | 4.8% |
| Maximum | 39.9% | 61.3% |
| Range | 33.1% | 56.4% |
| Mean | 19.8% | 32.6% |
| Median | 19.8% | 31.0% |
| Interquartile 25% (IQ1) | 16.3% | 25.2% |
| Interquartile 75% (IQ3) | 23.1% | 39.5% |
| Interquartile Range (IQR) | 6.8% | 14.3% |
| Standard Deviation (Sample) | 6.2% | 14.0% |
| Standard Deviation (Population) | 6.2% | 13.8% |
Similar Demographics by Disability Age 65 to 74
Demographics Similar to Immigrants from Sri Lanka by Disability Age 65 to 74
In terms of disability age 65 to 74, the demographic groups most similar to Immigrants from Sri Lanka are Immigrants from Argentina (21.1%, a difference of 0.030%), Bulgarian (21.1%, a difference of 0.050%), Turkish (21.0%, a difference of 0.23%), Immigrants from Switzerland (21.1%, a difference of 0.25%), and Immigrants from Northern Europe (21.0%, a difference of 0.27%).
| Demographics | Rating | Rank | Disability Age 65 to 74 |
| Immigrants | Sweden | 99.9 /100 | #27 | Exceptional 21.0% |
| Immigrants | Czechoslovakia | 99.9 /100 | #28 | Exceptional 21.0% |
| Immigrants | Japan | 99.9 /100 | #29 | Exceptional 21.0% |
| Immigrants | Greece | 99.9 /100 | #30 | Exceptional 21.0% |
| Immigrants | Northern Europe | 99.9 /100 | #31 | Exceptional 21.0% |
| Turks | 99.9 /100 | #32 | Exceptional 21.0% |
| Immigrants | Argentina | 99.9 /100 | #33 | Exceptional 21.1% |
| Immigrants | Sri Lanka | 99.9 /100 | #34 | Exceptional 21.1% |
| Bulgarians | 99.9 /100 | #35 | Exceptional 21.1% |
| Immigrants | Switzerland | 99.8 /100 | #36 | Exceptional 21.1% |
| Israelis | 99.8 /100 | #37 | Exceptional 21.2% |
| Russians | 99.8 /100 | #38 | Exceptional 21.2% |
| Argentineans | 99.8 /100 | #39 | Exceptional 21.2% |
| Latvians | 99.8 /100 | #40 | Exceptional 21.2% |
| Immigrants | Austria | 99.8 /100 | #41 | Exceptional 21.2% |
Demographics Similar to Paiute by Disability Age 65 to 74
In terms of disability age 65 to 74, the demographic groups most similar to Paiute are Chippewa (27.8%, a difference of 0.010%), Cajun (27.9%, a difference of 0.48%), Crow (27.9%, a difference of 0.53%), Immigrants from Armenia (28.0%, a difference of 0.62%), and Nepalese (28.0%, a difference of 0.84%).
| Demographics | Rating | Rank | Disability Age 65 to 74 |
| Blacks/African Americans | 0.0 /100 | #306 | Tragic 27.3% |
| Ute | 0.0 /100 | #307 | Tragic 27.3% |
| Sioux | 0.0 /100 | #308 | Tragic 27.3% |
| Yaqui | 0.0 /100 | #309 | Tragic 27.4% |
| Shoshone | 0.0 /100 | #310 | Tragic 27.4% |
| Menominee | 0.0 /100 | #311 | Tragic 27.4% |
| Osage | 0.0 /100 | #312 | Tragic 27.5% |
| Paiute | 0.0 /100 | #313 | Tragic 27.8% |
| Chippewa | 0.0 /100 | #314 | Tragic 27.8% |
| Cajuns | 0.0 /100 | #315 | Tragic 27.9% |
| Crow | 0.0 /100 | #316 | Tragic 27.9% |
| Immigrants | Armenia | 0.0 /100 | #317 | Tragic 28.0% |
| Nepalese | 0.0 /100 | #318 | Tragic 28.0% |
| Arapaho | 0.0 /100 | #319 | Tragic 28.1% |
| Cherokee | 0.0 /100 | #320 | Tragic 28.2% |