Immigrants from Sri Lanka vs Immigrants from Jamaica Disability Age 65 to 74
COMPARE
Immigrants from Sri Lanka
Immigrants from Jamaica
Disability Age 65 to 74
Disability Age 65 to 74 Comparison
Immigrants from Sri Lanka
Immigrants from Jamaica
21.1%
DISABILITY AGE 65 TO 74
99.9/ 100
METRIC RATING
34th/ 347
METRIC RANK
23.8%
DISABILITY AGE 65 TO 74
20.7/ 100
METRIC RATING
206th/ 347
METRIC RANK
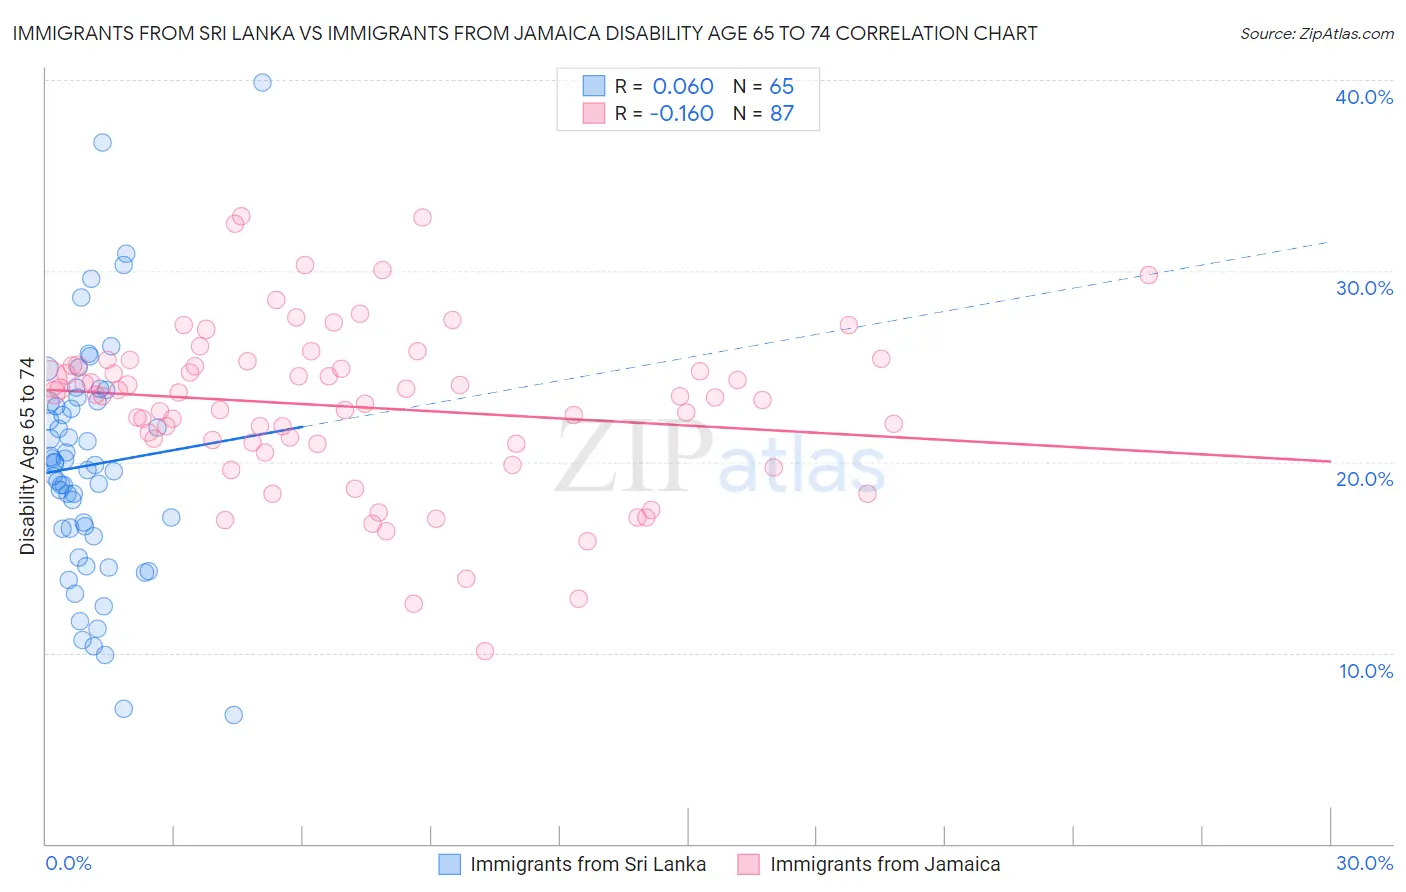
Immigrants from Sri Lanka vs Immigrants from Jamaica Disability Age 65 to 74 Correlation Chart
The statistical analysis conducted on geographies consisting of 149,658,794 people shows a slight positive correlation between the proportion of Immigrants from Sri Lanka and percentage of population with a disability between the ages 65 and 75 in the United States with a correlation coefficient (R) of 0.060 and weighted average of 21.1%. Similarly, the statistical analysis conducted on geographies consisting of 301,108,871 people shows a poor negative correlation between the proportion of Immigrants from Jamaica and percentage of population with a disability between the ages 65 and 75 in the United States with a correlation coefficient (R) of -0.160 and weighted average of 23.8%, a difference of 12.9%.
Disability Age 65 to 74 Correlation Summary
| Measurement | Immigrants from Sri Lanka | Immigrants from Jamaica |
| Minimum | 6.7% | 10.1% |
| Maximum | 39.9% | 32.9% |
| Range | 33.1% | 22.8% |
| Mean | 19.8% | 22.9% |
| Median | 19.8% | 23.5% |
| Interquartile 25% (IQ1) | 16.3% | 20.9% |
| Interquartile 75% (IQ3) | 23.1% | 25.1% |
| Interquartile Range (IQR) | 6.8% | 4.1% |
| Standard Deviation (Sample) | 6.2% | 4.3% |
| Standard Deviation (Population) | 6.2% | 4.3% |
Similar Demographics by Disability Age 65 to 74
Demographics Similar to Immigrants from Sri Lanka by Disability Age 65 to 74
In terms of disability age 65 to 74, the demographic groups most similar to Immigrants from Sri Lanka are Immigrants from Argentina (21.1%, a difference of 0.030%), Bulgarian (21.1%, a difference of 0.050%), Turkish (21.0%, a difference of 0.23%), Immigrants from Switzerland (21.1%, a difference of 0.25%), and Immigrants from Northern Europe (21.0%, a difference of 0.27%).
| Demographics | Rating | Rank | Disability Age 65 to 74 |
| Immigrants | Sweden | 99.9 /100 | #27 | Exceptional 21.0% |
| Immigrants | Czechoslovakia | 99.9 /100 | #28 | Exceptional 21.0% |
| Immigrants | Japan | 99.9 /100 | #29 | Exceptional 21.0% |
| Immigrants | Greece | 99.9 /100 | #30 | Exceptional 21.0% |
| Immigrants | Northern Europe | 99.9 /100 | #31 | Exceptional 21.0% |
| Turks | 99.9 /100 | #32 | Exceptional 21.0% |
| Immigrants | Argentina | 99.9 /100 | #33 | Exceptional 21.1% |
| Immigrants | Sri Lanka | 99.9 /100 | #34 | Exceptional 21.1% |
| Bulgarians | 99.9 /100 | #35 | Exceptional 21.1% |
| Immigrants | Switzerland | 99.8 /100 | #36 | Exceptional 21.1% |
| Israelis | 99.8 /100 | #37 | Exceptional 21.2% |
| Russians | 99.8 /100 | #38 | Exceptional 21.2% |
| Argentineans | 99.8 /100 | #39 | Exceptional 21.2% |
| Latvians | 99.8 /100 | #40 | Exceptional 21.2% |
| Immigrants | Austria | 99.8 /100 | #41 | Exceptional 21.2% |
Demographics Similar to Immigrants from Jamaica by Disability Age 65 to 74
In terms of disability age 65 to 74, the demographic groups most similar to Immigrants from Jamaica are Tongan (23.8%, a difference of 0.0%), Immigrants from Sudan (23.8%, a difference of 0.060%), Immigrants from Barbados (23.8%, a difference of 0.10%), Immigrants from Grenada (23.8%, a difference of 0.11%), and Immigrants from Kenya (23.8%, a difference of 0.11%).
| Demographics | Rating | Rank | Disability Age 65 to 74 |
| Welsh | 24.3 /100 | #199 | Fair 23.7% |
| French Canadians | 24.0 /100 | #200 | Fair 23.7% |
| Immigrants | Ecuador | 23.9 /100 | #201 | Fair 23.7% |
| Immigrants | Bahamas | 23.3 /100 | #202 | Fair 23.7% |
| Kenyans | 23.2 /100 | #203 | Fair 23.7% |
| Immigrants | Grenada | 22.1 /100 | #204 | Fair 23.8% |
| Tongans | 20.8 /100 | #205 | Fair 23.8% |
| Immigrants | Jamaica | 20.7 /100 | #206 | Fair 23.8% |
| Immigrants | Sudan | 20.1 /100 | #207 | Fair 23.8% |
| Immigrants | Barbados | 19.6 /100 | #208 | Poor 23.8% |
| Immigrants | Kenya | 19.6 /100 | #209 | Poor 23.8% |
| Trinidadians and Tobagonians | 16.4 /100 | #210 | Poor 23.9% |
| Immigrants | West Indies | 15.9 /100 | #211 | Poor 23.9% |
| French | 15.7 /100 | #212 | Poor 23.9% |
| Nicaraguans | 14.3 /100 | #213 | Poor 23.9% |