Immigrants from Kenya vs American Disability Age 65 to 74
COMPARE
Immigrants from Kenya
American
Disability Age 65 to 74
Disability Age 65 to 74 Comparison
Immigrants from Kenya
Americans
23.8%
DISABILITY AGE 65 TO 74
19.6/ 100
METRIC RATING
209th/ 347
METRIC RANK
25.8%
DISABILITY AGE 65 TO 74
0.1/ 100
METRIC RATING
274th/ 347
METRIC RANK
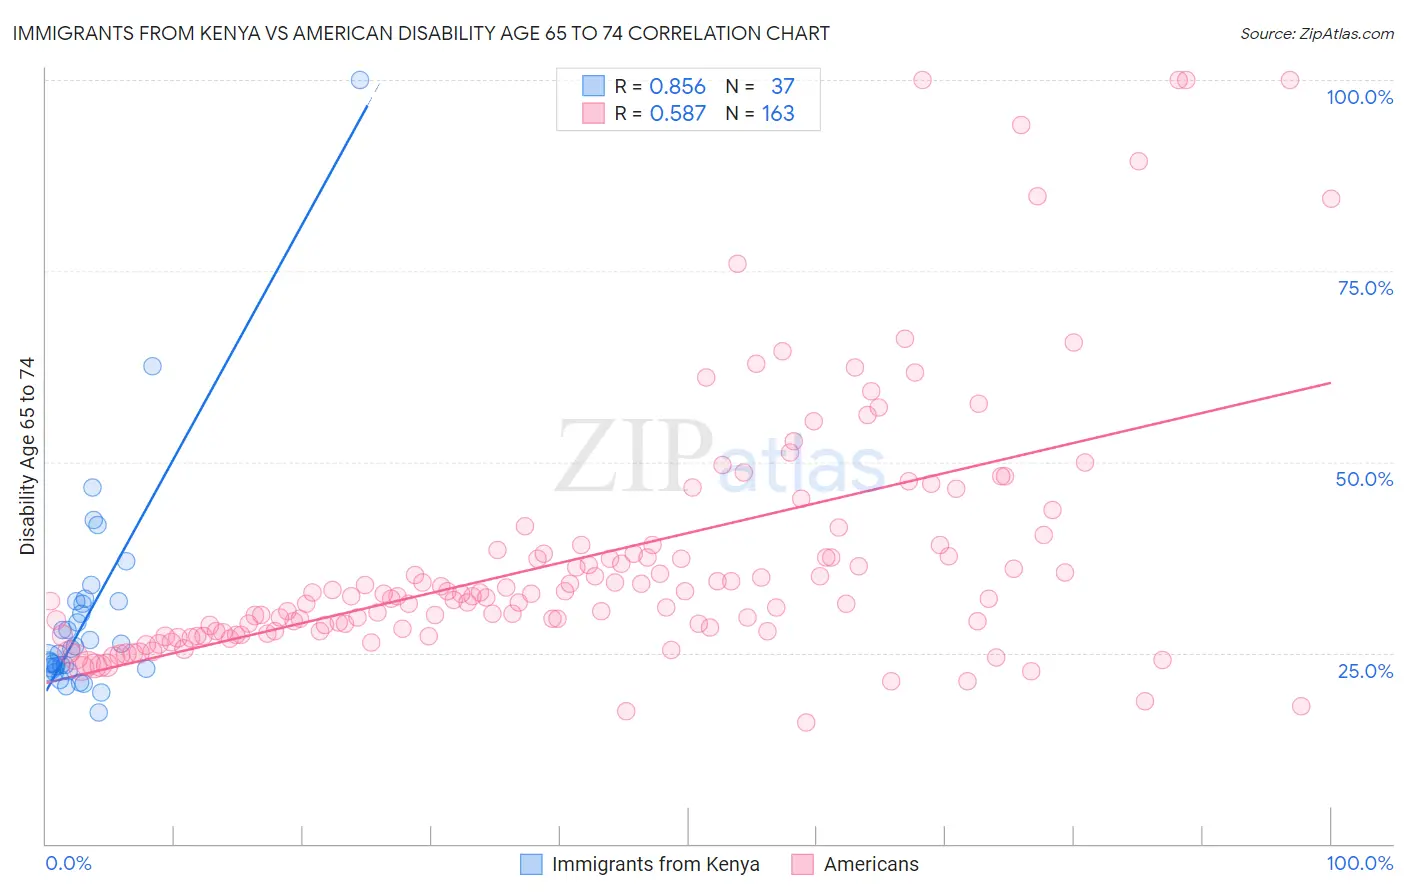
Immigrants from Kenya vs American Disability Age 65 to 74 Correlation Chart
The statistical analysis conducted on geographies consisting of 217,828,278 people shows a very strong positive correlation between the proportion of Immigrants from Kenya and percentage of population with a disability between the ages 65 and 75 in the United States with a correlation coefficient (R) of 0.856 and weighted average of 23.8%. Similarly, the statistical analysis conducted on geographies consisting of 579,149,624 people shows a substantial positive correlation between the proportion of Americans and percentage of population with a disability between the ages 65 and 75 in the United States with a correlation coefficient (R) of 0.587 and weighted average of 25.8%, a difference of 8.4%.
Disability Age 65 to 74 Correlation Summary
| Measurement | Immigrants from Kenya | American |
| Minimum | 17.1% | 15.8% |
| Maximum | 100.0% | 100.0% |
| Range | 82.9% | 84.2% |
| Mean | 30.1% | 37.4% |
| Median | 25.6% | 32.3% |
| Interquartile 25% (IQ1) | 23.0% | 27.8% |
| Interquartile 75% (IQ3) | 31.8% | 38.4% |
| Interquartile Range (IQR) | 8.8% | 10.7% |
| Standard Deviation (Sample) | 14.7% | 16.8% |
| Standard Deviation (Population) | 14.5% | 16.7% |
Similar Demographics by Disability Age 65 to 74
Demographics Similar to Immigrants from Kenya by Disability Age 65 to 74
In terms of disability age 65 to 74, the demographic groups most similar to Immigrants from Kenya are Immigrants from Barbados (23.8%, a difference of 0.0%), Immigrants from Sudan (23.8%, a difference of 0.050%), Tongan (23.8%, a difference of 0.11%), Immigrants from Jamaica (23.8%, a difference of 0.11%), and Immigrants from Grenada (23.8%, a difference of 0.22%).
| Demographics | Rating | Rank | Disability Age 65 to 74 |
| Immigrants | Bahamas | 23.3 /100 | #202 | Fair 23.7% |
| Kenyans | 23.2 /100 | #203 | Fair 23.7% |
| Immigrants | Grenada | 22.1 /100 | #204 | Fair 23.8% |
| Tongans | 20.8 /100 | #205 | Fair 23.8% |
| Immigrants | Jamaica | 20.7 /100 | #206 | Fair 23.8% |
| Immigrants | Sudan | 20.1 /100 | #207 | Fair 23.8% |
| Immigrants | Barbados | 19.6 /100 | #208 | Poor 23.8% |
| Immigrants | Kenya | 19.6 /100 | #209 | Poor 23.8% |
| Trinidadians and Tobagonians | 16.4 /100 | #210 | Poor 23.9% |
| Immigrants | West Indies | 15.9 /100 | #211 | Poor 23.9% |
| French | 15.7 /100 | #212 | Poor 23.9% |
| Nicaraguans | 14.3 /100 | #213 | Poor 23.9% |
| Immigrants | Oceania | 13.6 /100 | #214 | Poor 24.0% |
| Pennsylvania Germans | 13.3 /100 | #215 | Poor 24.0% |
| Jamaicans | 12.2 /100 | #216 | Poor 24.0% |
Demographics Similar to Americans by Disability Age 65 to 74
In terms of disability age 65 to 74, the demographic groups most similar to Americans are Honduran (25.8%, a difference of 0.010%), French American Indian (25.8%, a difference of 0.020%), Belizean (25.8%, a difference of 0.11%), Immigrants from Belize (25.8%, a difference of 0.13%), and U.S. Virgin Islander (25.9%, a difference of 0.21%).
| Demographics | Rating | Rank | Disability Age 65 to 74 |
| Ottawa | 0.1 /100 | #267 | Tragic 25.6% |
| Liberians | 0.1 /100 | #268 | Tragic 25.6% |
| Hmong | 0.1 /100 | #269 | Tragic 25.7% |
| Immigrants | Guatemala | 0.1 /100 | #270 | Tragic 25.7% |
| Immigrants | Liberia | 0.1 /100 | #271 | Tragic 25.7% |
| Immigrants | Dominica | 0.1 /100 | #272 | Tragic 25.7% |
| Japanese | 0.1 /100 | #273 | Tragic 25.7% |
| Americans | 0.1 /100 | #274 | Tragic 25.8% |
| Hondurans | 0.1 /100 | #275 | Tragic 25.8% |
| French American Indians | 0.1 /100 | #276 | Tragic 25.8% |
| Belizeans | 0.1 /100 | #277 | Tragic 25.8% |
| Immigrants | Belize | 0.1 /100 | #278 | Tragic 25.8% |
| U.S. Virgin Islanders | 0.1 /100 | #279 | Tragic 25.9% |
| Cree | 0.1 /100 | #280 | Tragic 25.9% |
| Immigrants | Honduras | 0.1 /100 | #281 | Tragic 25.9% |