Immigrants from South America vs Soviet Union Disability Age 5 to 17
COMPARE
Immigrants from South America
Soviet Union
Disability Age 5 to 17
Disability Age 5 to 17 Comparison
Immigrants from South America
Soviet Union
5.4%
DISABILITY AGE 5 TO 17
97.1/ 100
METRIC RATING
119th/ 347
METRIC RANK
5.0%
DISABILITY AGE 5 TO 17
100.0/ 100
METRIC RATING
32nd/ 347
METRIC RANK
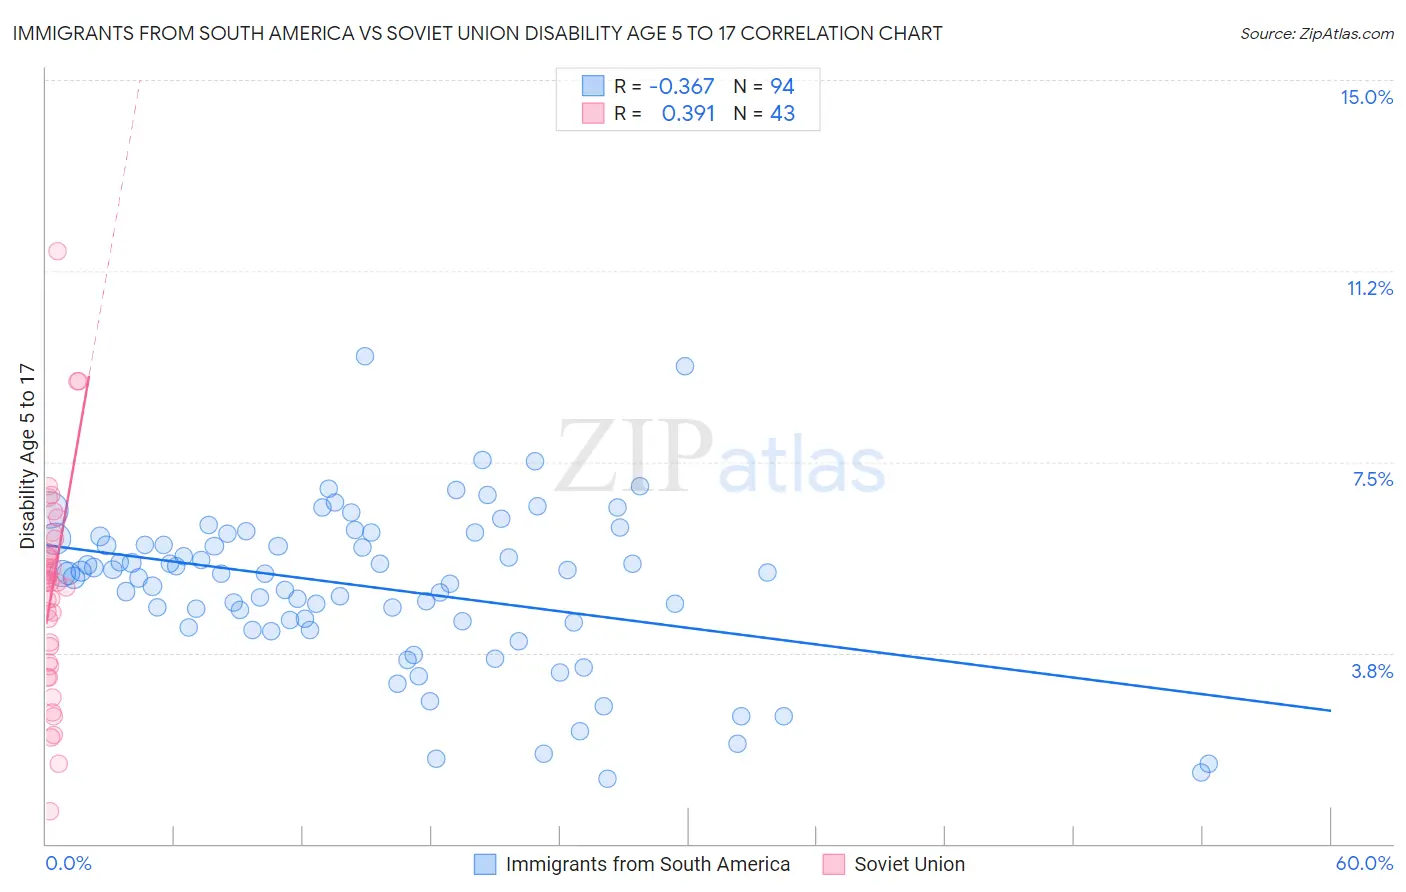
Immigrants from South America vs Soviet Union Disability Age 5 to 17 Correlation Chart
The statistical analysis conducted on geographies consisting of 479,990,297 people shows a mild negative correlation between the proportion of Immigrants from South America and percentage of population with a disability between the ages 5 and 17 in the United States with a correlation coefficient (R) of -0.367 and weighted average of 5.4%. Similarly, the statistical analysis conducted on geographies consisting of 43,434,016 people shows a mild positive correlation between the proportion of Soviet Union and percentage of population with a disability between the ages 5 and 17 in the United States with a correlation coefficient (R) of 0.391 and weighted average of 5.0%, a difference of 7.7%.
Disability Age 5 to 17 Correlation Summary
| Measurement | Immigrants from South America | Soviet Union |
| Minimum | 1.3% | 0.64% |
| Maximum | 9.6% | 11.6% |
| Range | 8.3% | 11.0% |
| Mean | 5.0% | 5.0% |
| Median | 5.3% | 5.2% |
| Interquartile 25% (IQ1) | 4.4% | 3.6% |
| Interquartile 75% (IQ3) | 6.0% | 5.7% |
| Interquartile Range (IQR) | 1.6% | 2.1% |
| Standard Deviation (Sample) | 1.6% | 2.0% |
| Standard Deviation (Population) | 1.6% | 2.0% |
Similar Demographics by Disability Age 5 to 17
Demographics Similar to Immigrants from South America by Disability Age 5 to 17
In terms of disability age 5 to 17, the demographic groups most similar to Immigrants from South America are South American (5.4%, a difference of 0.010%), Immigrants (5.4%, a difference of 0.050%), Immigrants from Afghanistan (5.3%, a difference of 0.11%), Cypriot (5.3%, a difference of 0.28%), and Cuban (5.3%, a difference of 0.34%).
| Demographics | Rating | Rank | Disability Age 5 to 17 |
| Immigrants | Latvia | 97.9 /100 | #112 | Exceptional 5.3% |
| Aleuts | 97.8 /100 | #113 | Exceptional 5.3% |
| Immigrants | Northern Europe | 97.8 /100 | #114 | Exceptional 5.3% |
| Cubans | 97.8 /100 | #115 | Exceptional 5.3% |
| Cypriots | 97.7 /100 | #116 | Exceptional 5.3% |
| Immigrants | Afghanistan | 97.4 /100 | #117 | Exceptional 5.3% |
| South Americans | 97.1 /100 | #118 | Exceptional 5.4% |
| Immigrants | South America | 97.1 /100 | #119 | Exceptional 5.4% |
| Immigrants | Immigrants | 97.0 /100 | #120 | Exceptional 5.4% |
| Maltese | 96.0 /100 | #121 | Exceptional 5.4% |
| Chileans | 95.8 /100 | #122 | Exceptional 5.4% |
| Immigrants | Ethiopia | 95.5 /100 | #123 | Exceptional 5.4% |
| Crow | 95.0 /100 | #124 | Exceptional 5.4% |
| Immigrants | Chile | 95.0 /100 | #125 | Exceptional 5.4% |
| New Zealanders | 95.0 /100 | #126 | Exceptional 5.4% |
Demographics Similar to Soviet Union by Disability Age 5 to 17
In terms of disability age 5 to 17, the demographic groups most similar to Soviet Union are Immigrants from Pakistan (5.0%, a difference of 0.040%), Immigrants from Malaysia (5.0%, a difference of 0.28%), Immigrants from Indonesia (5.0%, a difference of 0.32%), Israeli (5.0%, a difference of 0.44%), and Immigrants from Serbia (4.9%, a difference of 0.51%).
| Demographics | Rating | Rank | Disability Age 5 to 17 |
| Immigrants | Asia | 100.0 /100 | #25 | Exceptional 4.8% |
| Bhutanese | 100.0 /100 | #26 | Exceptional 4.9% |
| Taiwanese | 100.0 /100 | #27 | Exceptional 4.9% |
| Immigrants | Japan | 100.0 /100 | #28 | Exceptional 4.9% |
| Immigrants | Serbia | 100.0 /100 | #29 | Exceptional 4.9% |
| Immigrants | Malaysia | 100.0 /100 | #30 | Exceptional 5.0% |
| Immigrants | Pakistan | 100.0 /100 | #31 | Exceptional 5.0% |
| Soviet Union | 100.0 /100 | #32 | Exceptional 5.0% |
| Immigrants | Indonesia | 100.0 /100 | #33 | Exceptional 5.0% |
| Israelis | 100.0 /100 | #34 | Exceptional 5.0% |
| Bolivians | 100.0 /100 | #35 | Exceptional 5.0% |
| Immigrants | Egypt | 100.0 /100 | #36 | Exceptional 5.0% |
| Immigrants | Belarus | 100.0 /100 | #37 | Exceptional 5.0% |
| Immigrants | Philippines | 100.0 /100 | #38 | Exceptional 5.0% |
| Immigrants | Argentina | 100.0 /100 | #39 | Exceptional 5.0% |