Immigrants from South America vs Native/Alaskan 10th Grade
COMPARE
Immigrants from South America
Native/Alaskan
10th Grade
10th Grade Comparison
Immigrants from South America
Natives/Alaskans
92.6%
10TH GRADE
0.4/ 100
METRIC RATING
262nd/ 347
METRIC RANK
92.2%
10TH GRADE
0.1/ 100
METRIC RATING
279th/ 347
METRIC RANK
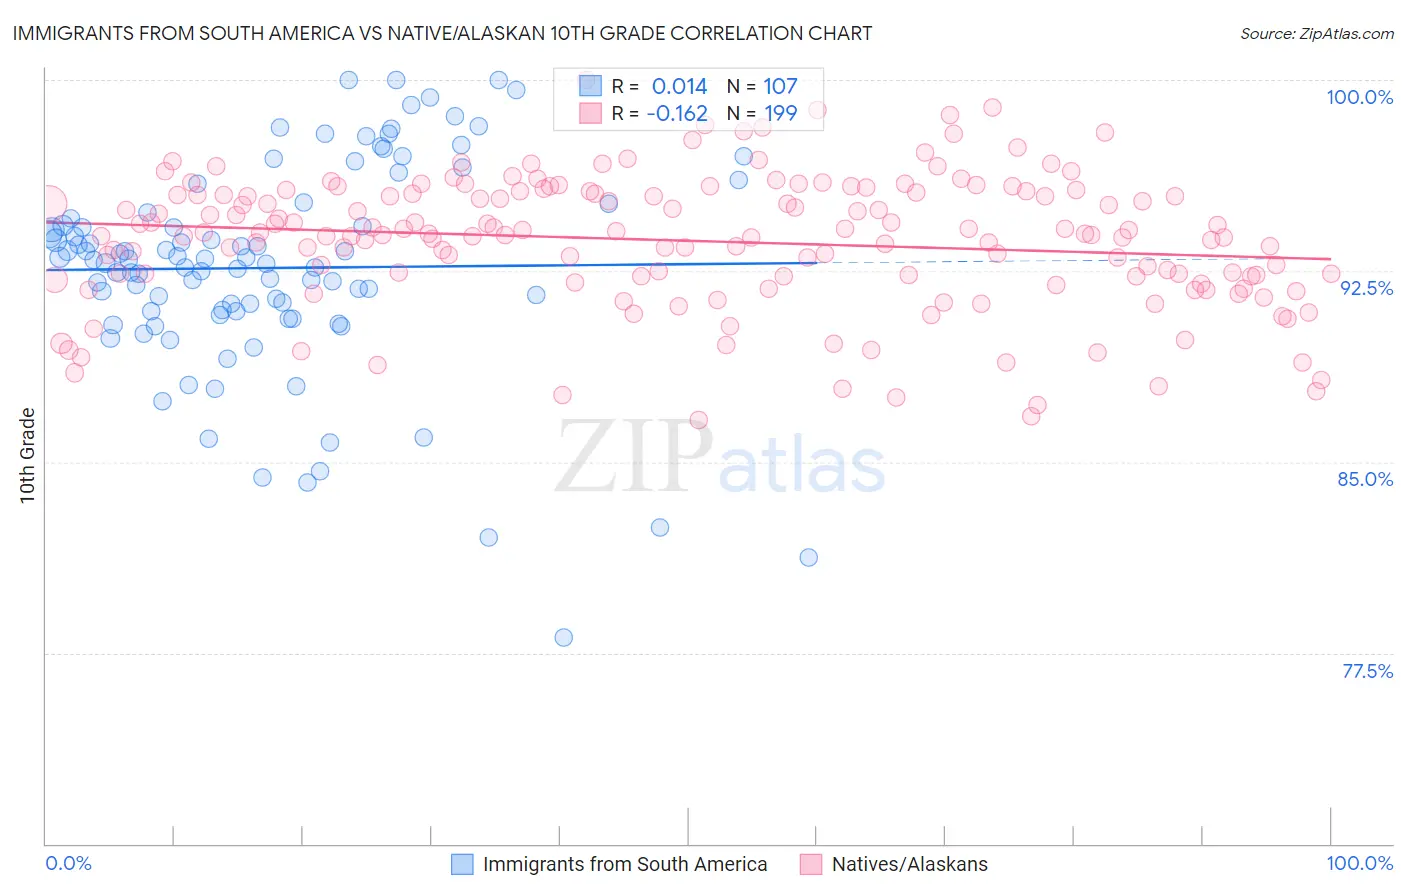
Immigrants from South America vs Native/Alaskan 10th Grade Correlation Chart
The statistical analysis conducted on geographies consisting of 486,312,594 people shows no correlation between the proportion of Immigrants from South America and percentage of population with at least 10th grade education in the United States with a correlation coefficient (R) of 0.014 and weighted average of 92.6%. Similarly, the statistical analysis conducted on geographies consisting of 513,060,394 people shows a poor negative correlation between the proportion of Natives/Alaskans and percentage of population with at least 10th grade education in the United States with a correlation coefficient (R) of -0.162 and weighted average of 92.2%, a difference of 0.40%.
10th Grade Correlation Summary
| Measurement | Immigrants from South America | Native/Alaskan |
| Minimum | 78.1% | 86.7% |
| Maximum | 100.0% | 100.0% |
| Range | 21.9% | 13.3% |
| Mean | 92.6% | 93.7% |
| Median | 92.9% | 93.9% |
| Interquartile 25% (IQ1) | 90.9% | 92.3% |
| Interquartile 75% (IQ3) | 94.8% | 95.6% |
| Interquartile Range (IQR) | 3.9% | 3.3% |
| Standard Deviation (Sample) | 4.2% | 2.6% |
| Standard Deviation (Population) | 4.1% | 2.6% |
Demographics Similar to Immigrants from South America and Natives/Alaskans by 10th Grade
In terms of 10th grade, the demographic groups most similar to Immigrants from South America are Apache (92.6%, a difference of 0.0%), Peruvian (92.6%, a difference of 0.0%), Paiute (92.6%, a difference of 0.010%), Dutch West Indian (92.6%, a difference of 0.030%), and Immigrants from Philippines (92.6%, a difference of 0.030%). Similarly, the demographic groups most similar to Natives/Alaskans are Barbadian (92.2%, a difference of 0.010%), Malaysian (92.2%, a difference of 0.030%), Navajo (92.3%, a difference of 0.040%), Immigrants from Trinidad and Tobago (92.3%, a difference of 0.12%), and Immigrants from Congo (92.4%, a difference of 0.24%).
| Demographics | Rating | Rank | 10th Grade |
| Immigrants | Uzbekistan | 0.5 /100 | #260 | Tragic 92.6% |
| Paiute | 0.4 /100 | #261 | Tragic 92.6% |
| Immigrants | South America | 0.4 /100 | #262 | Tragic 92.6% |
| Apache | 0.4 /100 | #263 | Tragic 92.6% |
| Peruvians | 0.4 /100 | #264 | Tragic 92.6% |
| Dutch West Indians | 0.4 /100 | #265 | Tragic 92.6% |
| Immigrants | Philippines | 0.4 /100 | #266 | Tragic 92.6% |
| Taiwanese | 0.3 /100 | #267 | Tragic 92.5% |
| Immigrants | Ghana | 0.3 /100 | #268 | Tragic 92.5% |
| Immigrants | Colombia | 0.3 /100 | #269 | Tragic 92.5% |
| Immigrants | Uruguay | 0.3 /100 | #270 | Tragic 92.5% |
| Immigrants | Eritrea | 0.3 /100 | #271 | Tragic 92.5% |
| Immigrants | Western Africa | 0.3 /100 | #272 | Tragic 92.5% |
| Trinidadians and Tobagonians | 0.2 /100 | #273 | Tragic 92.4% |
| Immigrants | Congo | 0.2 /100 | #274 | Tragic 92.4% |
| West Indians | 0.2 /100 | #275 | Tragic 92.4% |
| Immigrants | Trinidad and Tobago | 0.1 /100 | #276 | Tragic 92.3% |
| Navajo | 0.1 /100 | #277 | Tragic 92.3% |
| Barbadians | 0.1 /100 | #278 | Tragic 92.2% |
| Natives/Alaskans | 0.1 /100 | #279 | Tragic 92.2% |
| Malaysians | 0.1 /100 | #280 | Tragic 92.2% |