Immigrants from South America vs Palestinian Ambulatory Disability
COMPARE
Immigrants from South America
Palestinian
Ambulatory Disability
Ambulatory Disability Comparison
Immigrants from South America
Palestinians
5.8%
AMBULATORY DISABILITY
97.9/ 100
METRIC RATING
101st/ 347
METRIC RANK
5.7%
AMBULATORY DISABILITY
99.2/ 100
METRIC RATING
82nd/ 347
METRIC RANK
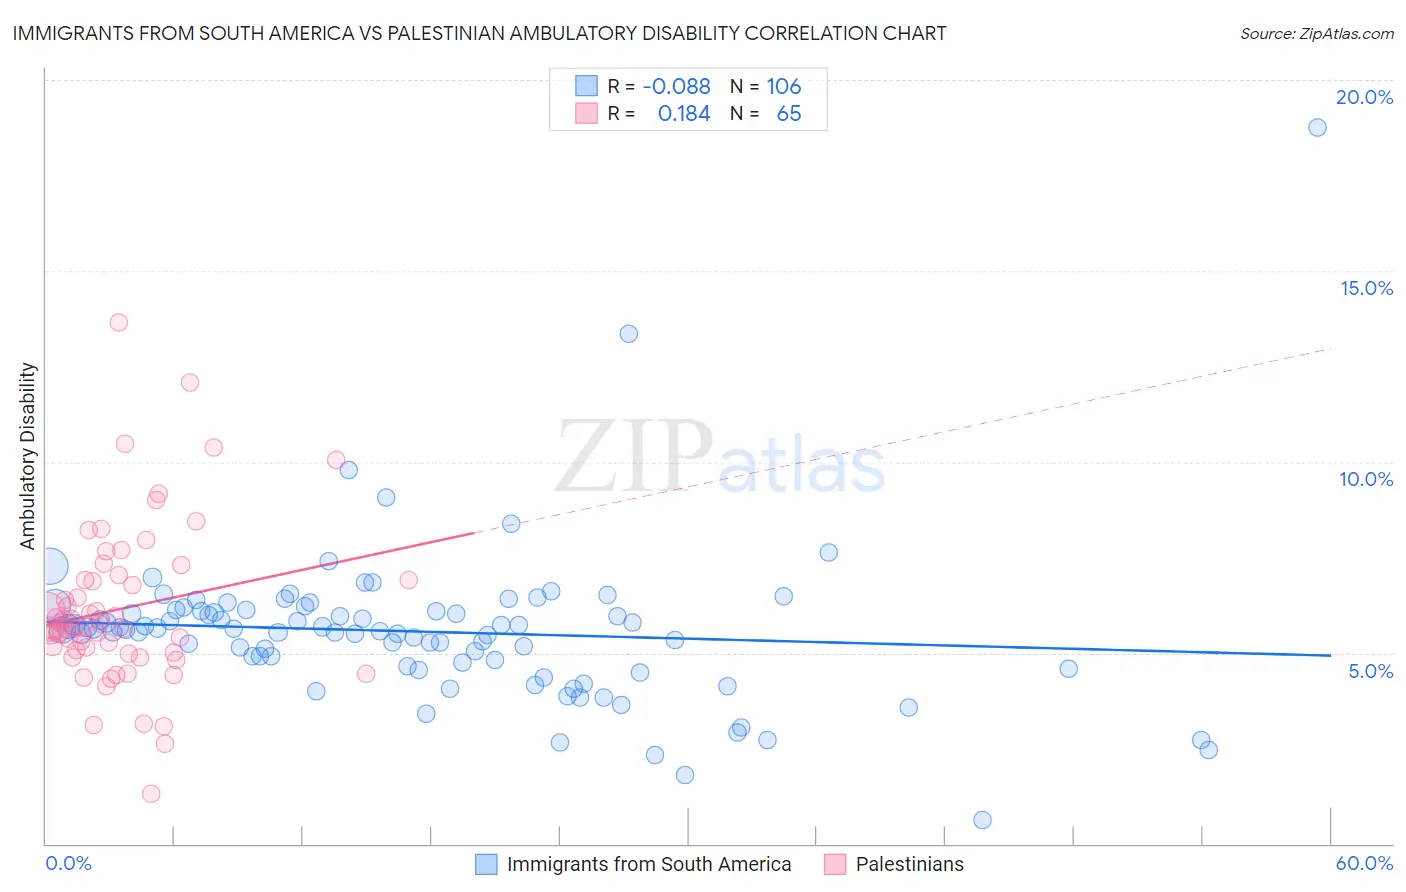
Immigrants from South America vs Palestinian Ambulatory Disability Correlation Chart
The statistical analysis conducted on geographies consisting of 486,161,675 people shows a slight negative correlation between the proportion of Immigrants from South America and percentage of population with ambulatory disability in the United States with a correlation coefficient (R) of -0.088 and weighted average of 5.8%. Similarly, the statistical analysis conducted on geographies consisting of 216,450,834 people shows a poor positive correlation between the proportion of Palestinians and percentage of population with ambulatory disability in the United States with a correlation coefficient (R) of 0.184 and weighted average of 5.7%, a difference of 1.3%.
Ambulatory Disability Correlation Summary
| Measurement | Immigrants from South America | Palestinian |
| Minimum | 0.63% | 1.3% |
| Maximum | 18.8% | 13.7% |
| Range | 18.1% | 12.3% |
| Mean | 5.6% | 6.2% |
| Median | 5.6% | 5.7% |
| Interquartile 25% (IQ1) | 4.7% | 5.0% |
| Interquartile 75% (IQ3) | 6.1% | 7.0% |
| Interquartile Range (IQR) | 1.4% | 2.0% |
| Standard Deviation (Sample) | 2.1% | 2.1% |
| Standard Deviation (Population) | 2.0% | 2.1% |
Demographics Similar to Immigrants from South America and Palestinians by Ambulatory Disability
In terms of ambulatory disability, the demographic groups most similar to Immigrants from South America are Immigrants from Serbia (5.8%, a difference of 0.0%), Immigrants from Northern Europe (5.8%, a difference of 0.19%), Immigrants from Lebanon (5.8%, a difference of 0.28%), Immigrants from Somalia (5.8%, a difference of 0.31%), and Salvadoran (5.8%, a difference of 0.35%). Similarly, the demographic groups most similar to Palestinians are Immigrants from Jordan (5.7%, a difference of 0.0%), Eastern European (5.7%, a difference of 0.020%), Ugandan (5.7%, a difference of 0.020%), South American (5.7%, a difference of 0.26%), and Latvian (5.7%, a difference of 0.29%).
| Demographics | Rating | Rank | Ambulatory Disability |
| Immigrants | Jordan | 99.2 /100 | #81 | Exceptional 5.7% |
| Palestinians | 99.2 /100 | #82 | Exceptional 5.7% |
| Eastern Europeans | 99.2 /100 | #83 | Exceptional 5.7% |
| Ugandans | 99.2 /100 | #84 | Exceptional 5.7% |
| South Americans | 99.0 /100 | #85 | Exceptional 5.7% |
| Latvians | 99.0 /100 | #86 | Exceptional 5.7% |
| Immigrants | Chile | 98.9 /100 | #87 | Exceptional 5.8% |
| Soviet Union | 98.9 /100 | #88 | Exceptional 5.8% |
| Bhutanese | 98.8 /100 | #89 | Exceptional 5.8% |
| Australians | 98.8 /100 | #90 | Exceptional 5.8% |
| Immigrants | Sudan | 98.8 /100 | #91 | Exceptional 5.8% |
| Immigrants | Sierra Leone | 98.6 /100 | #92 | Exceptional 5.8% |
| Immigrants | Denmark | 98.6 /100 | #93 | Exceptional 5.8% |
| Kenyans | 98.4 /100 | #94 | Exceptional 5.8% |
| Immigrants | El Salvador | 98.4 /100 | #95 | Exceptional 5.8% |
| Salvadorans | 98.4 /100 | #96 | Exceptional 5.8% |
| Immigrants | Somalia | 98.3 /100 | #97 | Exceptional 5.8% |
| Immigrants | Lebanon | 98.3 /100 | #98 | Exceptional 5.8% |
| Immigrants | Northern Europe | 98.2 /100 | #99 | Exceptional 5.8% |
| Immigrants | Serbia | 97.9 /100 | #100 | Exceptional 5.8% |
| Immigrants | South America | 97.9 /100 | #101 | Exceptional 5.8% |