Immigrants from South Africa vs Immigrants from Barbados Female Disability
COMPARE
Immigrants from South Africa
Immigrants from Barbados
Female Disability
Female Disability Comparison
Immigrants from South Africa
Immigrants from Barbados
11.5%
FEMALE DISABILITY
99.7/ 100
METRIC RATING
78th/ 347
METRIC RANK
12.3%
FEMALE DISABILITY
21.1/ 100
METRIC RATING
203rd/ 347
METRIC RANK
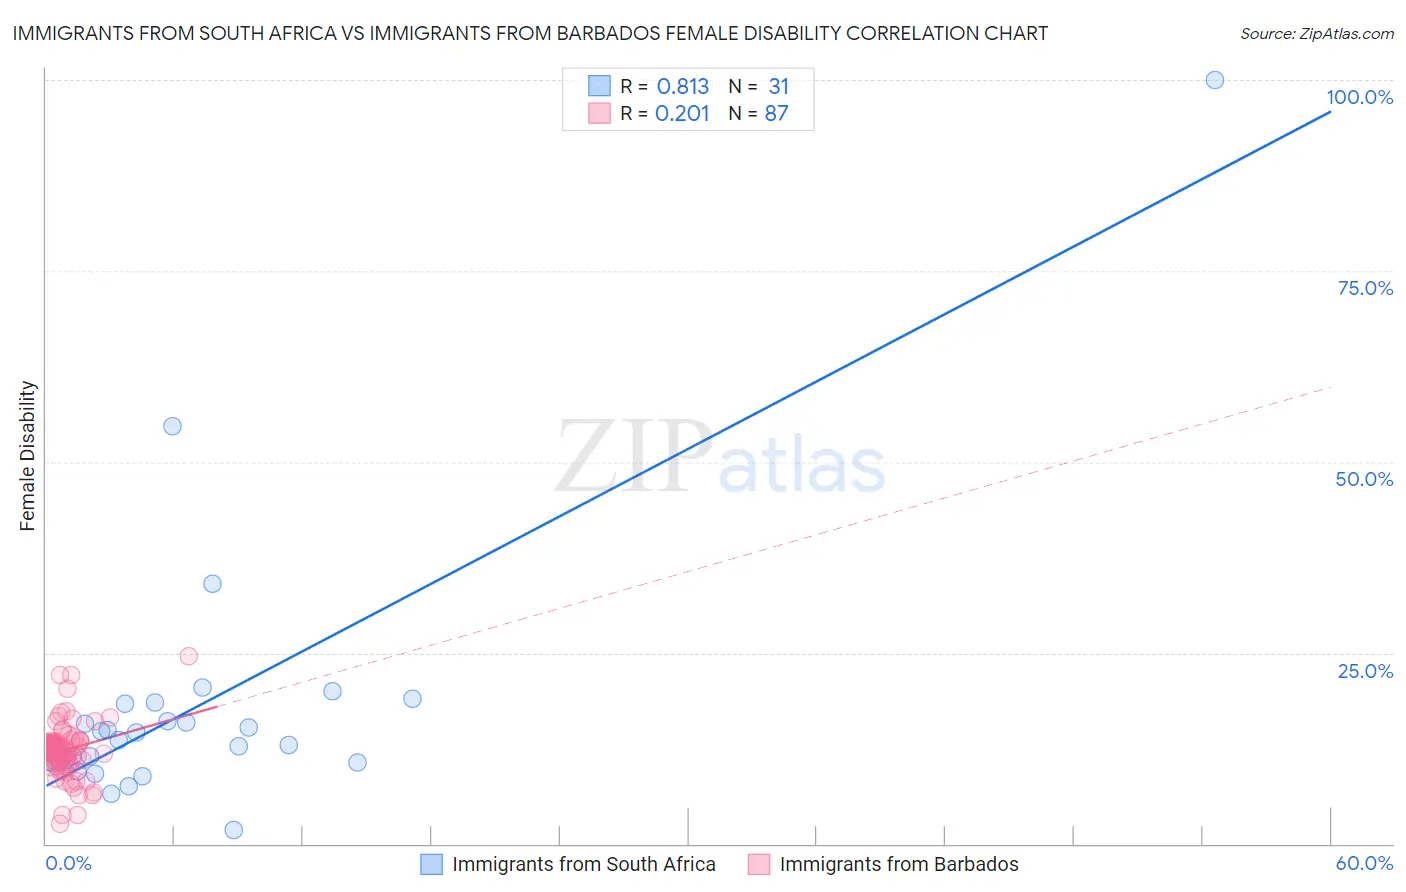
Immigrants from South Africa vs Immigrants from Barbados Female Disability Correlation Chart
The statistical analysis conducted on geographies consisting of 233,307,950 people shows a very strong positive correlation between the proportion of Immigrants from South Africa and percentage of females with a disability in the United States with a correlation coefficient (R) of 0.813 and weighted average of 11.5%. Similarly, the statistical analysis conducted on geographies consisting of 112,784,400 people shows a weak positive correlation between the proportion of Immigrants from Barbados and percentage of females with a disability in the United States with a correlation coefficient (R) of 0.201 and weighted average of 12.3%, a difference of 7.2%.
Female Disability Correlation Summary
| Measurement | Immigrants from South Africa | Immigrants from Barbados |
| Minimum | 1.8% | 2.7% |
| Maximum | 100.0% | 24.6% |
| Range | 98.2% | 21.9% |
| Mean | 17.8% | 12.2% |
| Median | 13.6% | 12.4% |
| Interquartile 25% (IQ1) | 10.6% | 10.9% |
| Interquartile 75% (IQ3) | 18.3% | 13.3% |
| Interquartile Range (IQR) | 7.7% | 2.4% |
| Standard Deviation (Sample) | 17.8% | 3.5% |
| Standard Deviation (Population) | 17.5% | 3.5% |
Similar Demographics by Female Disability
Demographics Similar to Immigrants from South Africa by Female Disability
In terms of female disability, the demographic groups most similar to Immigrants from South Africa are Immigrants from Eritrea (11.5%, a difference of 0.010%), Immigrants from Afghanistan (11.5%, a difference of 0.010%), Sierra Leonean (11.5%, a difference of 0.020%), Immigrants from Jordan (11.5%, a difference of 0.030%), and Immigrants from Lebanon (11.5%, a difference of 0.040%).
| Demographics | Rating | Rank | Female Disability |
| Immigrants | Ireland | 99.8 /100 | #71 | Exceptional 11.5% |
| Chileans | 99.8 /100 | #72 | Exceptional 11.5% |
| Immigrants | Switzerland | 99.8 /100 | #73 | Exceptional 11.5% |
| Bhutanese | 99.8 /100 | #74 | Exceptional 11.5% |
| Immigrants | Lebanon | 99.7 /100 | #75 | Exceptional 11.5% |
| Immigrants | Eritrea | 99.7 /100 | #76 | Exceptional 11.5% |
| Immigrants | Afghanistan | 99.7 /100 | #77 | Exceptional 11.5% |
| Immigrants | South Africa | 99.7 /100 | #78 | Exceptional 11.5% |
| Sierra Leoneans | 99.7 /100 | #79 | Exceptional 11.5% |
| Immigrants | Jordan | 99.7 /100 | #80 | Exceptional 11.5% |
| Eastern Europeans | 99.7 /100 | #81 | Exceptional 11.5% |
| Luxembourgers | 99.6 /100 | #82 | Exceptional 11.6% |
| Immigrants | Serbia | 99.6 /100 | #83 | Exceptional 11.6% |
| Immigrants | Poland | 99.6 /100 | #84 | Exceptional 11.6% |
| Palestinians | 99.6 /100 | #85 | Exceptional 11.6% |
Demographics Similar to Immigrants from Barbados by Female Disability
In terms of female disability, the demographic groups most similar to Immigrants from Barbados are Somali (12.3%, a difference of 0.020%), Immigrants from Zaire (12.3%, a difference of 0.020%), Immigrants from Grenada (12.4%, a difference of 0.040%), Chinese (12.3%, a difference of 0.050%), and Immigrants from Cuba (12.4%, a difference of 0.050%).
| Demographics | Rating | Rank | Female Disability |
| Immigrants | Panama | 25.5 /100 | #196 | Fair 12.3% |
| Hondurans | 25.4 /100 | #197 | Fair 12.3% |
| Mexican American Indians | 24.9 /100 | #198 | Fair 12.3% |
| Immigrants | Trinidad and Tobago | 24.7 /100 | #199 | Fair 12.3% |
| Trinidadians and Tobagonians | 22.4 /100 | #200 | Fair 12.3% |
| Chinese | 22.1 /100 | #201 | Fair 12.3% |
| Somalis | 21.5 /100 | #202 | Fair 12.3% |
| Immigrants | Barbados | 21.1 /100 | #203 | Fair 12.3% |
| Immigrants | Zaire | 20.9 /100 | #204 | Fair 12.3% |
| Immigrants | Grenada | 20.5 /100 | #205 | Fair 12.4% |
| Immigrants | Cuba | 20.2 /100 | #206 | Fair 12.4% |
| Croatians | 20.2 /100 | #207 | Fair 12.4% |
| Basques | 17.5 /100 | #208 | Poor 12.4% |
| Mexicans | 15.7 /100 | #209 | Poor 12.4% |
| Swiss | 14.9 /100 | #210 | Poor 12.4% |