Immigrants from South Africa vs Immigrants from Ukraine Female Disability
COMPARE
Immigrants from South Africa
Immigrants from Ukraine
Female Disability
Female Disability Comparison
Immigrants from South Africa
Immigrants from Ukraine
11.5%
FEMALE DISABILITY
99.7/ 100
METRIC RATING
78th/ 347
METRIC RANK
12.1%
FEMALE DISABILITY
64.3/ 100
METRIC RATING
162nd/ 347
METRIC RANK
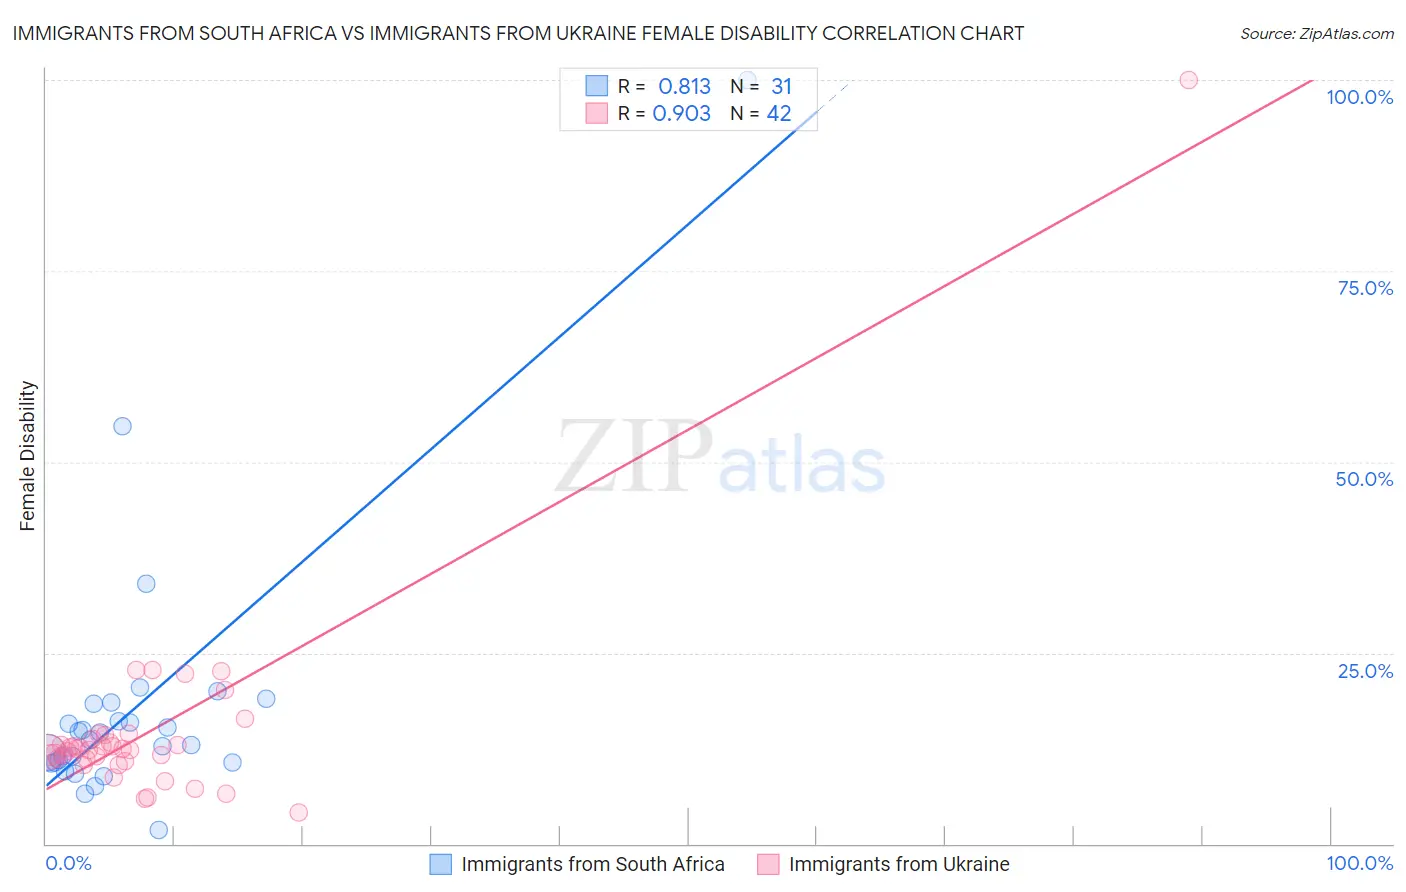
Immigrants from South Africa vs Immigrants from Ukraine Female Disability Correlation Chart
The statistical analysis conducted on geographies consisting of 233,307,950 people shows a very strong positive correlation between the proportion of Immigrants from South Africa and percentage of females with a disability in the United States with a correlation coefficient (R) of 0.813 and weighted average of 11.5%. Similarly, the statistical analysis conducted on geographies consisting of 289,686,189 people shows a near-perfect positive correlation between the proportion of Immigrants from Ukraine and percentage of females with a disability in the United States with a correlation coefficient (R) of 0.903 and weighted average of 12.1%, a difference of 5.3%.
Female Disability Correlation Summary
| Measurement | Immigrants from South Africa | Immigrants from Ukraine |
| Minimum | 1.8% | 4.1% |
| Maximum | 100.0% | 100.0% |
| Range | 98.2% | 95.9% |
| Mean | 17.8% | 14.7% |
| Median | 13.6% | 12.4% |
| Interquartile 25% (IQ1) | 10.6% | 11.1% |
| Interquartile 75% (IQ3) | 18.3% | 13.7% |
| Interquartile Range (IQR) | 7.7% | 2.6% |
| Standard Deviation (Sample) | 17.8% | 14.2% |
| Standard Deviation (Population) | 17.5% | 14.0% |
Similar Demographics by Female Disability
Demographics Similar to Immigrants from South Africa by Female Disability
In terms of female disability, the demographic groups most similar to Immigrants from South Africa are Immigrants from Eritrea (11.5%, a difference of 0.010%), Immigrants from Afghanistan (11.5%, a difference of 0.010%), Sierra Leonean (11.5%, a difference of 0.020%), Immigrants from Jordan (11.5%, a difference of 0.030%), and Immigrants from Lebanon (11.5%, a difference of 0.040%).
| Demographics | Rating | Rank | Female Disability |
| Immigrants | Ireland | 99.8 /100 | #71 | Exceptional 11.5% |
| Chileans | 99.8 /100 | #72 | Exceptional 11.5% |
| Immigrants | Switzerland | 99.8 /100 | #73 | Exceptional 11.5% |
| Bhutanese | 99.8 /100 | #74 | Exceptional 11.5% |
| Immigrants | Lebanon | 99.7 /100 | #75 | Exceptional 11.5% |
| Immigrants | Eritrea | 99.7 /100 | #76 | Exceptional 11.5% |
| Immigrants | Afghanistan | 99.7 /100 | #77 | Exceptional 11.5% |
| Immigrants | South Africa | 99.7 /100 | #78 | Exceptional 11.5% |
| Sierra Leoneans | 99.7 /100 | #79 | Exceptional 11.5% |
| Immigrants | Jordan | 99.7 /100 | #80 | Exceptional 11.5% |
| Eastern Europeans | 99.7 /100 | #81 | Exceptional 11.5% |
| Luxembourgers | 99.6 /100 | #82 | Exceptional 11.6% |
| Immigrants | Serbia | 99.6 /100 | #83 | Exceptional 11.6% |
| Immigrants | Poland | 99.6 /100 | #84 | Exceptional 11.6% |
| Palestinians | 99.6 /100 | #85 | Exceptional 11.6% |
Demographics Similar to Immigrants from Ukraine by Female Disability
In terms of female disability, the demographic groups most similar to Immigrants from Ukraine are Guyanese (12.1%, a difference of 0.010%), Guatemalan (12.1%, a difference of 0.020%), Czech (12.1%, a difference of 0.030%), Immigrants from Guatemala (12.1%, a difference of 0.070%), and Immigrants from Oceania (12.1%, a difference of 0.10%).
| Demographics | Rating | Rank | Female Disability |
| Ghanaians | 76.6 /100 | #155 | Good 12.1% |
| Moroccans | 72.9 /100 | #156 | Good 12.1% |
| Danes | 72.5 /100 | #157 | Good 12.1% |
| Immigrants | Middle Africa | 72.4 /100 | #158 | Good 12.1% |
| Immigrants | Central America | 67.7 /100 | #159 | Good 12.1% |
| Immigrants | Guatemala | 66.0 /100 | #160 | Good 12.1% |
| Guyanese | 64.7 /100 | #161 | Good 12.1% |
| Immigrants | Ukraine | 64.3 /100 | #162 | Good 12.1% |
| Guatemalans | 63.8 /100 | #163 | Good 12.1% |
| Czechs | 63.6 /100 | #164 | Good 12.1% |
| Immigrants | Oceania | 61.8 /100 | #165 | Good 12.1% |
| Lithuanians | 59.5 /100 | #166 | Average 12.2% |
| Immigrants | Latin America | 59.0 /100 | #167 | Average 12.2% |
| Immigrants | Haiti | 58.8 /100 | #168 | Average 12.2% |
| Lebanese | 58.1 /100 | #169 | Average 12.2% |