Immigrants from South Africa vs Alaskan Athabascan Female Poverty Among 18-24 Year Olds
COMPARE
Immigrants from South Africa
Alaskan Athabascan
Female Poverty Among 18-24 Year Olds
Female Poverty Among 18-24 Year Olds Comparison
Immigrants from South Africa
Alaskan Athabascans
20.6%
FEMALE POVERTY AMONG 18-24 YEAR OLDS
10.7/ 100
METRIC RATING
214th/ 347
METRIC RANK
22.5%
FEMALE POVERTY AMONG 18-24 YEAR OLDS
0.0/ 100
METRIC RATING
292nd/ 347
METRIC RANK
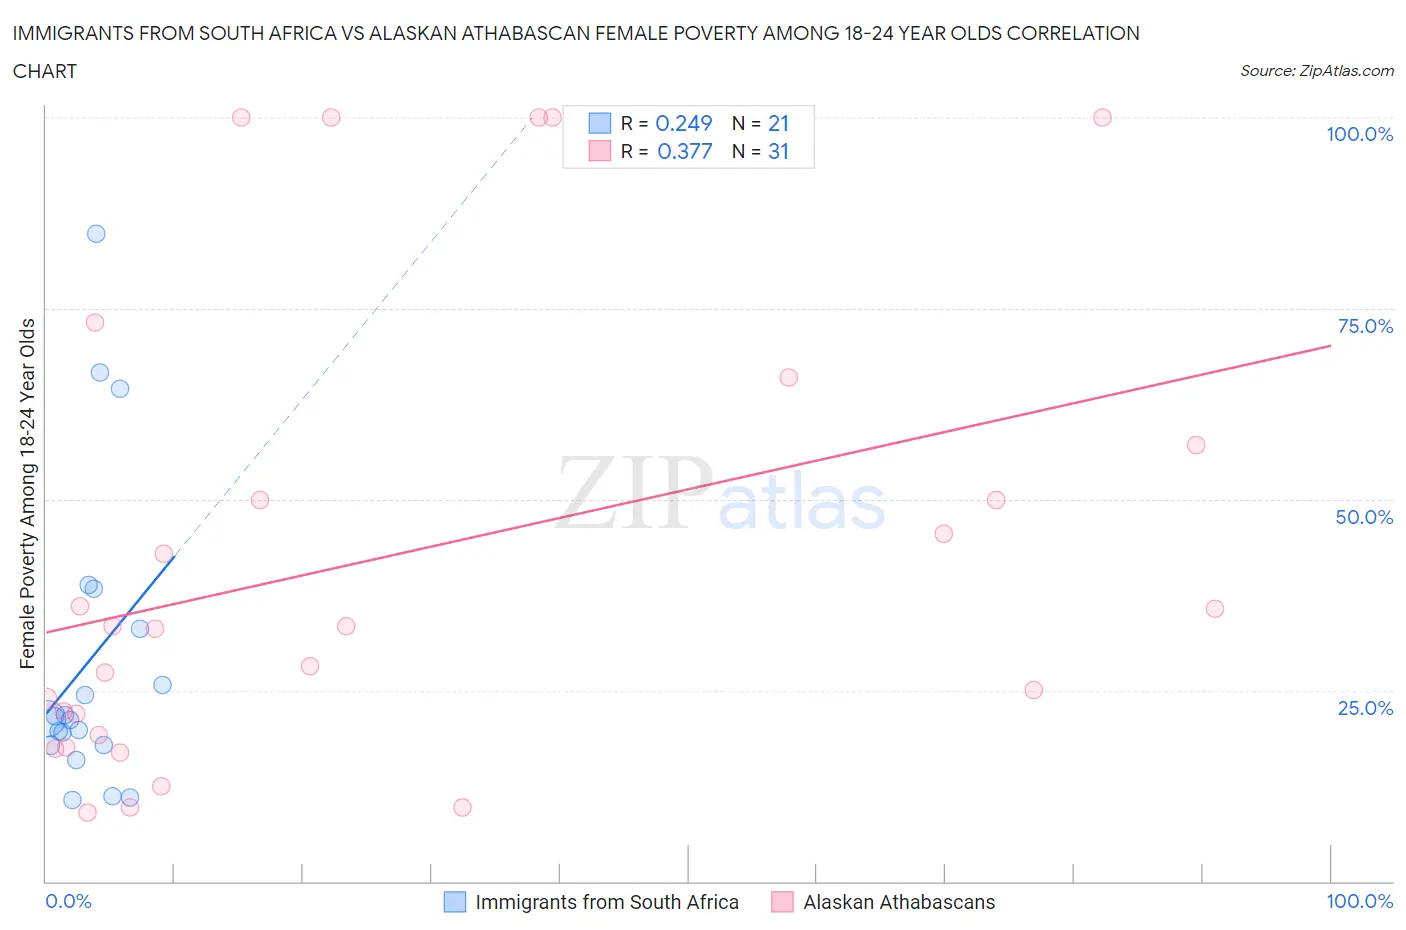
Immigrants from South Africa vs Alaskan Athabascan Female Poverty Among 18-24 Year Olds Correlation Chart
The statistical analysis conducted on geographies consisting of 229,352,607 people shows a weak positive correlation between the proportion of Immigrants from South Africa and poverty level among females between the ages 18 and 24 in the United States with a correlation coefficient (R) of 0.249 and weighted average of 20.6%. Similarly, the statistical analysis conducted on geographies consisting of 45,408,377 people shows a mild positive correlation between the proportion of Alaskan Athabascans and poverty level among females between the ages 18 and 24 in the United States with a correlation coefficient (R) of 0.377 and weighted average of 22.5%, a difference of 9.0%.
Female Poverty Among 18-24 Year Olds Correlation Summary
| Measurement | Immigrants from South Africa | Alaskan Athabascan |
| Minimum | 10.6% | 9.0% |
| Maximum | 84.8% | 100.0% |
| Range | 74.2% | 91.0% |
| Mean | 28.8% | 42.5% |
| Median | 21.3% | 33.3% |
| Interquartile 25% (IQ1) | 17.8% | 19.2% |
| Interquartile 75% (IQ3) | 35.7% | 57.1% |
| Interquartile Range (IQR) | 17.9% | 37.9% |
| Standard Deviation (Sample) | 19.9% | 30.1% |
| Standard Deviation (Population) | 19.4% | 29.7% |
Similar Demographics by Female Poverty Among 18-24 Year Olds
Demographics Similar to Immigrants from South Africa by Female Poverty Among 18-24 Year Olds
In terms of female poverty among 18-24 year olds, the demographic groups most similar to Immigrants from South Africa are Spanish (20.6%, a difference of 0.040%), Immigrants from Western Africa (20.6%, a difference of 0.050%), Northern European (20.6%, a difference of 0.11%), Liberian (20.6%, a difference of 0.12%), and Immigrants from Laos (20.6%, a difference of 0.13%).
| Demographics | Rating | Rank | Female Poverty Among 18-24 Year Olds |
| Spaniards | 16.3 /100 | #207 | Poor 20.5% |
| Dutch | 15.9 /100 | #208 | Poor 20.5% |
| Arabs | 15.5 /100 | #209 | Poor 20.5% |
| Immigrants | Ghana | 14.3 /100 | #210 | Poor 20.5% |
| Immigrants | Western Europe | 13.5 /100 | #211 | Poor 20.6% |
| Liberians | 11.6 /100 | #212 | Poor 20.6% |
| Northern Europeans | 11.6 /100 | #213 | Poor 20.6% |
| Immigrants | South Africa | 10.7 /100 | #214 | Poor 20.6% |
| Spanish | 10.4 /100 | #215 | Poor 20.6% |
| Immigrants | Western Africa | 10.2 /100 | #216 | Poor 20.6% |
| Immigrants | Laos | 9.7 /100 | #217 | Tragic 20.6% |
| Immigrants | Nepal | 9.6 /100 | #218 | Tragic 20.7% |
| Immigrants | Micronesia | 9.6 /100 | #219 | Tragic 20.7% |
| British | 9.4 /100 | #220 | Tragic 20.7% |
| Barbadians | 9.0 /100 | #221 | Tragic 20.7% |
Demographics Similar to Alaskan Athabascans by Female Poverty Among 18-24 Year Olds
In terms of female poverty among 18-24 year olds, the demographic groups most similar to Alaskan Athabascans are U.S. Virgin Islander (22.5%, a difference of 0.030%), Bangladeshi (22.5%, a difference of 0.050%), Indonesian (22.5%, a difference of 0.070%), Shoshone (22.5%, a difference of 0.19%), and Menominee (22.5%, a difference of 0.30%).
| Demographics | Rating | Rank | Female Poverty Among 18-24 Year Olds |
| Ottawa | 0.0 /100 | #285 | Tragic 22.0% |
| Ugandans | 0.0 /100 | #286 | Tragic 22.1% |
| Immigrants | Middle Africa | 0.0 /100 | #287 | Tragic 22.1% |
| Dominicans | 0.0 /100 | #288 | Tragic 22.3% |
| French American Indians | 0.0 /100 | #289 | Tragic 22.3% |
| Immigrants | Senegal | 0.0 /100 | #290 | Tragic 22.4% |
| Bangladeshis | 0.0 /100 | #291 | Tragic 22.5% |
| Alaskan Athabascans | 0.0 /100 | #292 | Tragic 22.5% |
| U.S. Virgin Islanders | 0.0 /100 | #293 | Tragic 22.5% |
| Indonesians | 0.0 /100 | #294 | Tragic 22.5% |
| Shoshone | 0.0 /100 | #295 | Tragic 22.5% |
| Menominee | 0.0 /100 | #296 | Tragic 22.5% |
| Inupiat | 0.0 /100 | #297 | Tragic 22.6% |
| Central American Indians | 0.0 /100 | #298 | Tragic 22.6% |
| Cherokee | 0.0 /100 | #299 | Tragic 22.7% |