Immigrants from Somalia vs Immigrants from Italy Unemployment Among Seniors over 75 years
COMPARE
Immigrants from Somalia
Immigrants from Italy
Unemployment Among Seniors over 75 years
Unemployment Among Seniors over 75 years Comparison
Immigrants from Somalia
Immigrants from Italy
8.8%
UNEMPLOYMENT AMONG SENIORS OVER 75 YEARS
41.7/ 100
METRIC RATING
180th/ 347
METRIC RANK
8.8%
UNEMPLOYMENT AMONG SENIORS OVER 75 YEARS
41.7/ 100
METRIC RATING
179th/ 347
METRIC RANK
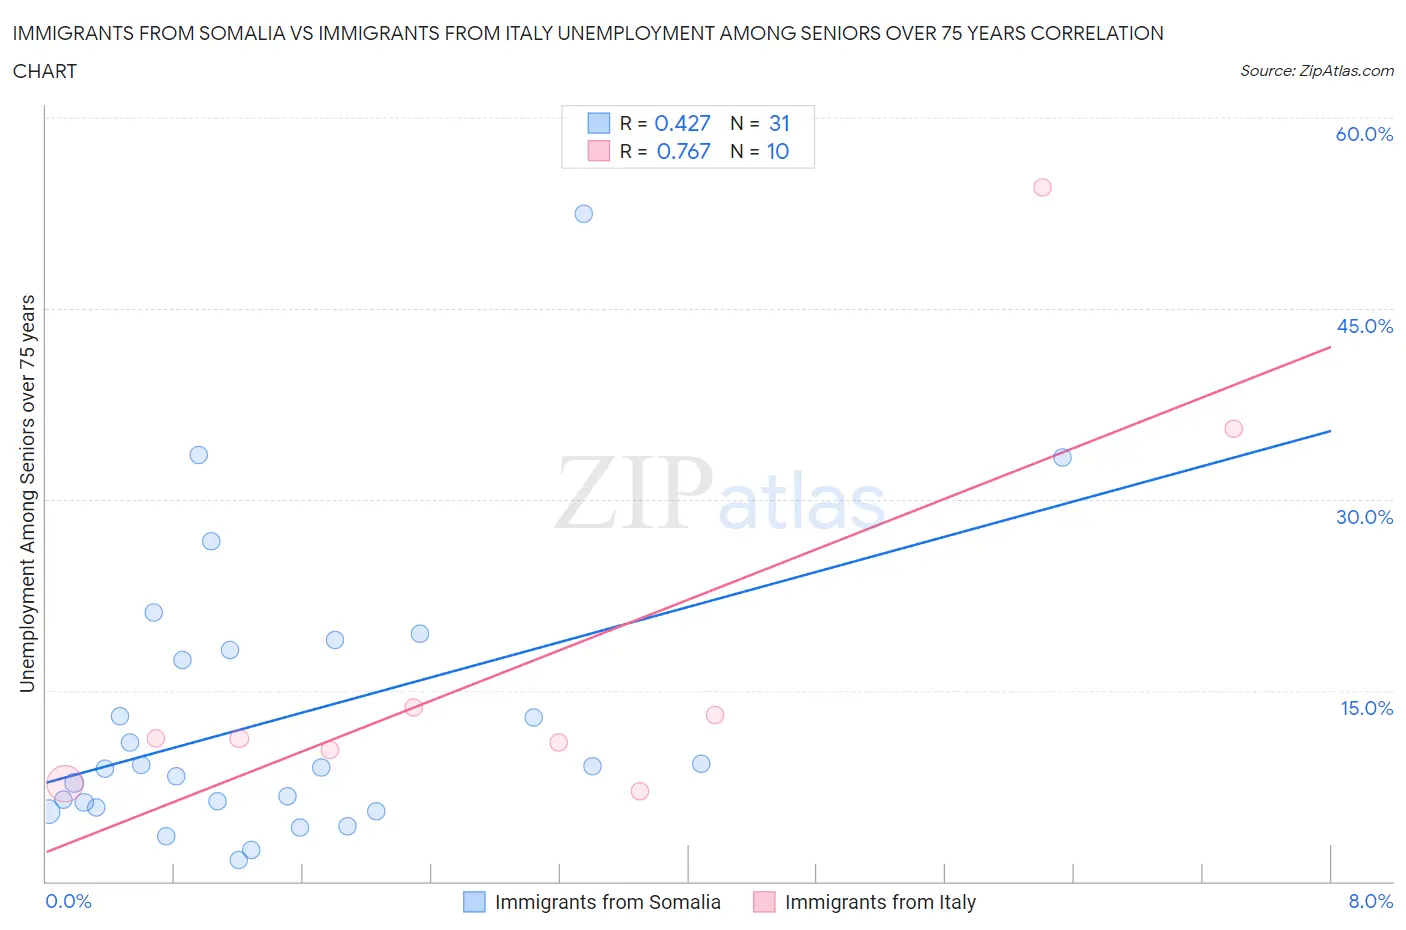
Immigrants from Somalia vs Immigrants from Italy Unemployment Among Seniors over 75 years Correlation Chart
The statistical analysis conducted on geographies consisting of 68,154,047 people shows a moderate positive correlation between the proportion of Immigrants from Somalia and unemployment rate among seniors over the age of 75 in the United States with a correlation coefficient (R) of 0.427 and weighted average of 8.8%. Similarly, the statistical analysis conducted on geographies consisting of 180,124,185 people shows a strong positive correlation between the proportion of Immigrants from Italy and unemployment rate among seniors over the age of 75 in the United States with a correlation coefficient (R) of 0.767 and weighted average of 8.8%, a difference of 0.0%.
Unemployment Among Seniors over 75 years Correlation Summary
| Measurement | Immigrants from Somalia | Immigrants from Italy |
| Minimum | 1.7% | 7.1% |
| Maximum | 52.4% | 54.5% |
| Range | 50.7% | 47.4% |
| Mean | 12.8% | 17.5% |
| Median | 8.9% | 11.2% |
| Interquartile 25% (IQ1) | 5.8% | 10.3% |
| Interquartile 75% (IQ3) | 18.2% | 13.7% |
| Interquartile Range (IQR) | 12.4% | 3.4% |
| Standard Deviation (Sample) | 11.1% | 15.3% |
| Standard Deviation (Population) | 10.9% | 14.5% |
Demographics Similar to Immigrants from Somalia and Immigrants from Italy by Unemployment Among Seniors over 75 years
In terms of unemployment among seniors over 75 years, the demographic groups most similar to Immigrants from Somalia are West Indian (8.8%, a difference of 0.010%), Immigrants from Thailand (8.8%, a difference of 0.080%), Central American (8.8%, a difference of 0.090%), Guatemalan (8.8%, a difference of 0.12%), and Immigrants from Afghanistan (8.8%, a difference of 0.19%). Similarly, the demographic groups most similar to Immigrants from Italy are West Indian (8.8%, a difference of 0.010%), Immigrants from Thailand (8.8%, a difference of 0.080%), Central American (8.8%, a difference of 0.090%), Guatemalan (8.8%, a difference of 0.12%), and Immigrants from Afghanistan (8.8%, a difference of 0.19%).
| Demographics | Rating | Rank | Unemployment Among Seniors over 75 years |
| Fijians | 56.4 /100 | #169 | Average 8.7% |
| Zimbabweans | 54.1 /100 | #170 | Average 8.7% |
| Dominicans | 51.9 /100 | #171 | Average 8.7% |
| Immigrants | Immigrants | 51.8 /100 | #172 | Average 8.7% |
| Australians | 50.3 /100 | #173 | Average 8.7% |
| Immigrants | El Salvador | 49.7 /100 | #174 | Average 8.7% |
| Syrians | 49.6 /100 | #175 | Average 8.7% |
| Somalis | 45.3 /100 | #176 | Average 8.8% |
| Central Americans | 43.3 /100 | #177 | Average 8.8% |
| West Indians | 41.9 /100 | #178 | Average 8.8% |
| Immigrants | Italy | 41.7 /100 | #179 | Average 8.8% |
| Immigrants | Somalia | 41.7 /100 | #180 | Average 8.8% |
| Immigrants | Thailand | 40.2 /100 | #181 | Average 8.8% |
| Guatemalans | 39.5 /100 | #182 | Fair 8.8% |
| Immigrants | Afghanistan | 38.2 /100 | #183 | Fair 8.8% |
| Immigrants | Micronesia | 37.2 /100 | #184 | Fair 8.8% |
| Choctaw | 37.1 /100 | #185 | Fair 8.8% |
| Immigrants | Ethiopia | 36.2 /100 | #186 | Fair 8.8% |
| Immigrants | Europe | 35.2 /100 | #187 | Fair 8.8% |
| Immigrants | Eastern Europe | 34.7 /100 | #188 | Fair 8.8% |
| Immigrants | Haiti | 34.7 /100 | #189 | Fair 8.8% |