Immigrants from Somalia vs Immigrants from Bosnia and Herzegovina Hearing Disability
COMPARE
Immigrants from Somalia
Immigrants from Bosnia and Herzegovina
Hearing Disability
Hearing Disability Comparison
Immigrants from Somalia
Immigrants from Bosnia and Herzegovina
2.8%
HEARING DISABILITY
95.5/ 100
METRIC RATING
96th/ 347
METRIC RANK
3.1%
HEARING DISABILITY
20.6/ 100
METRIC RATING
197th/ 347
METRIC RANK
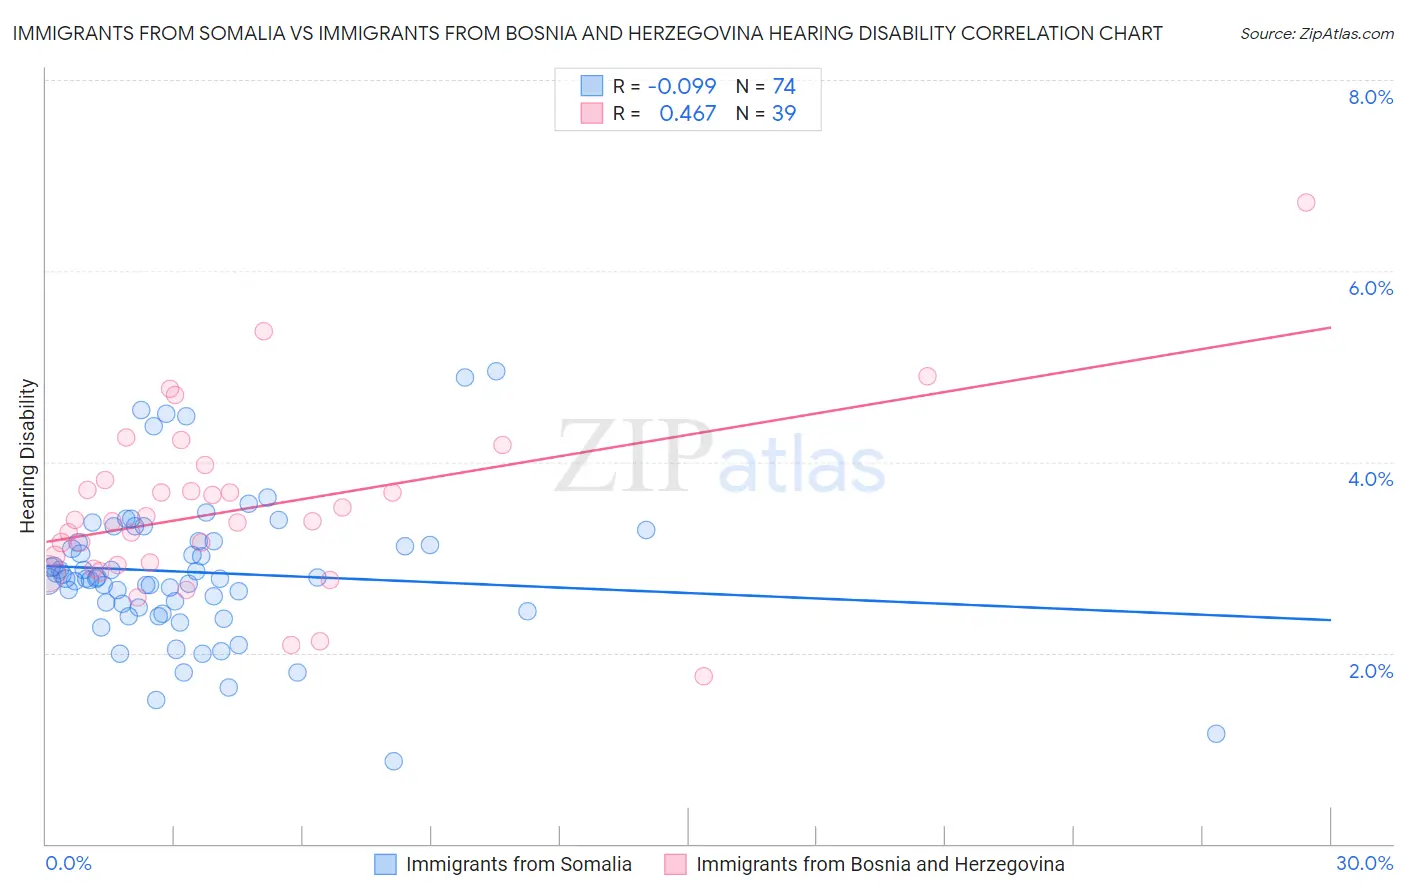
Immigrants from Somalia vs Immigrants from Bosnia and Herzegovina Hearing Disability Correlation Chart
The statistical analysis conducted on geographies consisting of 92,097,804 people shows a slight negative correlation between the proportion of Immigrants from Somalia and percentage of population with hearing disability in the United States with a correlation coefficient (R) of -0.099 and weighted average of 2.8%. Similarly, the statistical analysis conducted on geographies consisting of 156,806,751 people shows a moderate positive correlation between the proportion of Immigrants from Bosnia and Herzegovina and percentage of population with hearing disability in the United States with a correlation coefficient (R) of 0.467 and weighted average of 3.1%, a difference of 11.2%.
Hearing Disability Correlation Summary
| Measurement | Immigrants from Somalia | Immigrants from Bosnia and Herzegovina |
| Minimum | 0.87% | 1.8% |
| Maximum | 5.0% | 6.7% |
| Range | 4.1% | 5.0% |
| Mean | 2.8% | 3.5% |
| Median | 2.8% | 3.4% |
| Interquartile 25% (IQ1) | 2.5% | 2.9% |
| Interquartile 75% (IQ3) | 3.2% | 3.8% |
| Interquartile Range (IQR) | 0.69% | 0.89% |
| Standard Deviation (Sample) | 0.75% | 0.93% |
| Standard Deviation (Population) | 0.75% | 0.91% |
Similar Demographics by Hearing Disability
Demographics Similar to Immigrants from Somalia by Hearing Disability
In terms of hearing disability, the demographic groups most similar to Immigrants from Somalia are Immigrants from Afghanistan (2.8%, a difference of 0.17%), Israeli (2.8%, a difference of 0.19%), Uruguayan (2.8%, a difference of 0.21%), Immigrants from Honduras (2.8%, a difference of 0.23%), and Immigrants from Guatemala (2.8%, a difference of 0.27%).
| Demographics | Rating | Rank | Hearing Disability |
| Belizeans | 96.6 /100 | #89 | Exceptional 2.8% |
| Immigrants | Morocco | 96.6 /100 | #90 | Exceptional 2.8% |
| Immigrants | Middle Africa | 96.5 /100 | #91 | Exceptional 2.8% |
| Iranians | 96.4 /100 | #92 | Exceptional 2.8% |
| Immigrants | Kuwait | 96.3 /100 | #93 | Exceptional 2.8% |
| Uruguayans | 95.9 /100 | #94 | Exceptional 2.8% |
| Israelis | 95.9 /100 | #95 | Exceptional 2.8% |
| Immigrants | Somalia | 95.5 /100 | #96 | Exceptional 2.8% |
| Immigrants | Afghanistan | 95.3 /100 | #97 | Exceptional 2.8% |
| Immigrants | Honduras | 95.1 /100 | #98 | Exceptional 2.8% |
| Immigrants | Guatemala | 95.1 /100 | #99 | Exceptional 2.8% |
| Immigrants | Eastern Africa | 95.0 /100 | #100 | Exceptional 2.8% |
| Immigrants | Spain | 94.9 /100 | #101 | Exceptional 2.8% |
| Taiwanese | 94.8 /100 | #102 | Exceptional 2.8% |
| Immigrants | Indonesia | 94.7 /100 | #103 | Exceptional 2.8% |
Demographics Similar to Immigrants from Bosnia and Herzegovina by Hearing Disability
In terms of hearing disability, the demographic groups most similar to Immigrants from Bosnia and Herzegovina are Immigrants from Croatia (3.1%, a difference of 0.020%), Syrian (3.1%, a difference of 0.20%), Immigrants from North Macedonia (3.1%, a difference of 0.21%), Iraqi (3.1%, a difference of 0.24%), and Immigrants from Europe (3.1%, a difference of 0.30%).
| Demographics | Rating | Rank | Hearing Disability |
| Immigrants | South Africa | 31.1 /100 | #190 | Fair 3.1% |
| Immigrants | Switzerland | 28.8 /100 | #191 | Fair 3.1% |
| Koreans | 27.6 /100 | #192 | Fair 3.1% |
| Macedonians | 27.0 /100 | #193 | Fair 3.1% |
| South Africans | 24.5 /100 | #194 | Fair 3.1% |
| Spanish American Indians | 24.1 /100 | #195 | Fair 3.1% |
| Immigrants | Europe | 22.9 /100 | #196 | Fair 3.1% |
| Immigrants | Bosnia and Herzegovina | 20.6 /100 | #197 | Fair 3.1% |
| Immigrants | Croatia | 20.5 /100 | #198 | Fair 3.1% |
| Syrians | 19.2 /100 | #199 | Poor 3.1% |
| Immigrants | North Macedonia | 19.1 /100 | #200 | Poor 3.1% |
| Iraqis | 19.0 /100 | #201 | Poor 3.1% |
| Immigrants | Thailand | 16.4 /100 | #202 | Poor 3.1% |
| Immigrants | Denmark | 16.2 /100 | #203 | Poor 3.1% |
| Immigrants | Czechoslovakia | 15.9 /100 | #204 | Poor 3.1% |