Immigrants from Barbados vs Estonian Disability Age 5 to 17
COMPARE
Immigrants from Barbados
Estonian
Disability Age 5 to 17
Disability Age 5 to 17 Comparison
Immigrants from Barbados
Estonians
5.6%
DISABILITY AGE 5 TO 17
40.5/ 100
METRIC RATING
179th/ 347
METRIC RANK
5.5%
DISABILITY AGE 5 TO 17
80.8/ 100
METRIC RATING
151st/ 347
METRIC RANK
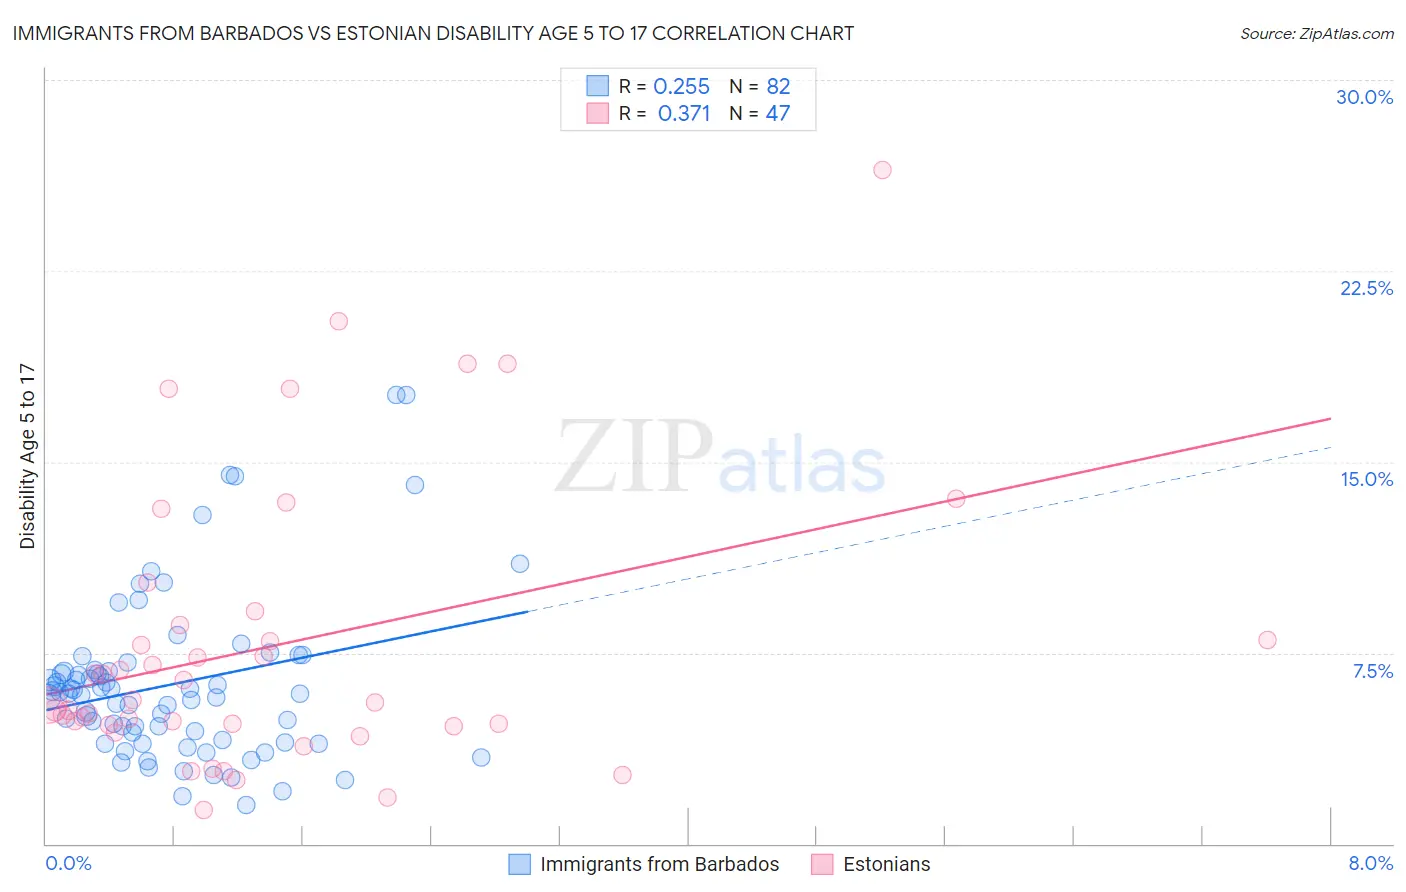
Immigrants from Barbados vs Estonian Disability Age 5 to 17 Correlation Chart
The statistical analysis conducted on geographies consisting of 112,576,995 people shows a weak positive correlation between the proportion of Immigrants from Barbados and percentage of population with a disability between the ages 5 and 17 in the United States with a correlation coefficient (R) of 0.255 and weighted average of 5.6%. Similarly, the statistical analysis conducted on geographies consisting of 122,980,183 people shows a mild positive correlation between the proportion of Estonians and percentage of population with a disability between the ages 5 and 17 in the United States with a correlation coefficient (R) of 0.371 and weighted average of 5.5%, a difference of 2.3%.
Disability Age 5 to 17 Correlation Summary
| Measurement | Immigrants from Barbados | Estonian |
| Minimum | 1.5% | 1.3% |
| Maximum | 17.6% | 26.5% |
| Range | 16.1% | 25.2% |
| Mean | 6.3% | 7.8% |
| Median | 5.9% | 5.5% |
| Interquartile 25% (IQ1) | 4.1% | 4.7% |
| Interquartile 75% (IQ3) | 6.8% | 8.6% |
| Interquartile Range (IQR) | 2.7% | 3.9% |
| Standard Deviation (Sample) | 3.2% | 5.6% |
| Standard Deviation (Population) | 3.2% | 5.5% |
Similar Demographics by Disability Age 5 to 17
Demographics Similar to Immigrants from Barbados by Disability Age 5 to 17
In terms of disability age 5 to 17, the demographic groups most similar to Immigrants from Barbados are Immigrants from Uruguay (5.6%, a difference of 0.14%), Immigrants from England (5.6%, a difference of 0.21%), Mexican American Indian (5.6%, a difference of 0.27%), Immigrants from Latin America (5.6%, a difference of 0.32%), and Syrian (5.6%, a difference of 0.35%).
| Demographics | Rating | Rank | Disability Age 5 to 17 |
| Ukrainians | 51.5 /100 | #172 | Average 5.6% |
| Uruguayans | 51.0 /100 | #173 | Average 5.6% |
| Costa Ricans | 50.0 /100 | #174 | Average 5.6% |
| Shoshone | 49.4 /100 | #175 | Average 5.6% |
| Immigrants | Central America | 49.4 /100 | #176 | Average 5.6% |
| Immigrants | Western Europe | 47.8 /100 | #177 | Average 5.6% |
| Immigrants | Trinidad and Tobago | 47.6 /100 | #178 | Average 5.6% |
| Immigrants | Barbados | 40.5 /100 | #179 | Average 5.6% |
| Immigrants | Uruguay | 37.7 /100 | #180 | Fair 5.6% |
| Immigrants | England | 36.4 /100 | #181 | Fair 5.6% |
| Mexican American Indians | 35.2 /100 | #182 | Fair 5.6% |
| Immigrants | Latin America | 34.3 /100 | #183 | Fair 5.6% |
| Syrians | 33.8 /100 | #184 | Fair 5.6% |
| Immigrants | Mexico | 33.7 /100 | #185 | Fair 5.6% |
| Fijians | 31.7 /100 | #186 | Fair 5.7% |
Demographics Similar to Estonians by Disability Age 5 to 17
In terms of disability age 5 to 17, the demographic groups most similar to Estonians are Ute (5.5%, a difference of 0.010%), Guatemalan (5.5%, a difference of 0.060%), Central American (5.5%, a difference of 0.070%), Ecuadorian (5.5%, a difference of 0.080%), and Samoan (5.5%, a difference of 0.10%).
| Demographics | Rating | Rank | Disability Age 5 to 17 |
| Pakistanis | 87.3 /100 | #144 | Excellent 5.5% |
| Immigrants | Guatemala | 86.6 /100 | #145 | Excellent 5.5% |
| Albanians | 83.7 /100 | #146 | Excellent 5.5% |
| Immigrants | Albania | 83.1 /100 | #147 | Excellent 5.5% |
| Samoans | 81.9 /100 | #148 | Excellent 5.5% |
| Central Americans | 81.6 /100 | #149 | Excellent 5.5% |
| Guatemalans | 81.5 /100 | #150 | Excellent 5.5% |
| Estonians | 80.8 /100 | #151 | Excellent 5.5% |
| Ute | 80.6 /100 | #152 | Excellent 5.5% |
| Ecuadorians | 79.7 /100 | #153 | Good 5.5% |
| Australians | 78.8 /100 | #154 | Good 5.5% |
| Immigrants | Ecuador | 78.3 /100 | #155 | Good 5.5% |
| Hawaiians | 78.0 /100 | #156 | Good 5.5% |
| Immigrants | Costa Rica | 77.9 /100 | #157 | Good 5.5% |
| Immigrants | Nepal | 77.1 /100 | #158 | Good 5.5% |