Immigrants from Saudi Arabia vs Potawatomi Male Disability
COMPARE
Immigrants from Saudi Arabia
Potawatomi
Male Disability
Male Disability Comparison
Immigrants from Saudi Arabia
Potawatomi
10.4%
MALE DISABILITY
99.6/ 100
METRIC RATING
52nd/ 347
METRIC RANK
14.2%
MALE DISABILITY
0.0/ 100
METRIC RATING
327th/ 347
METRIC RANK
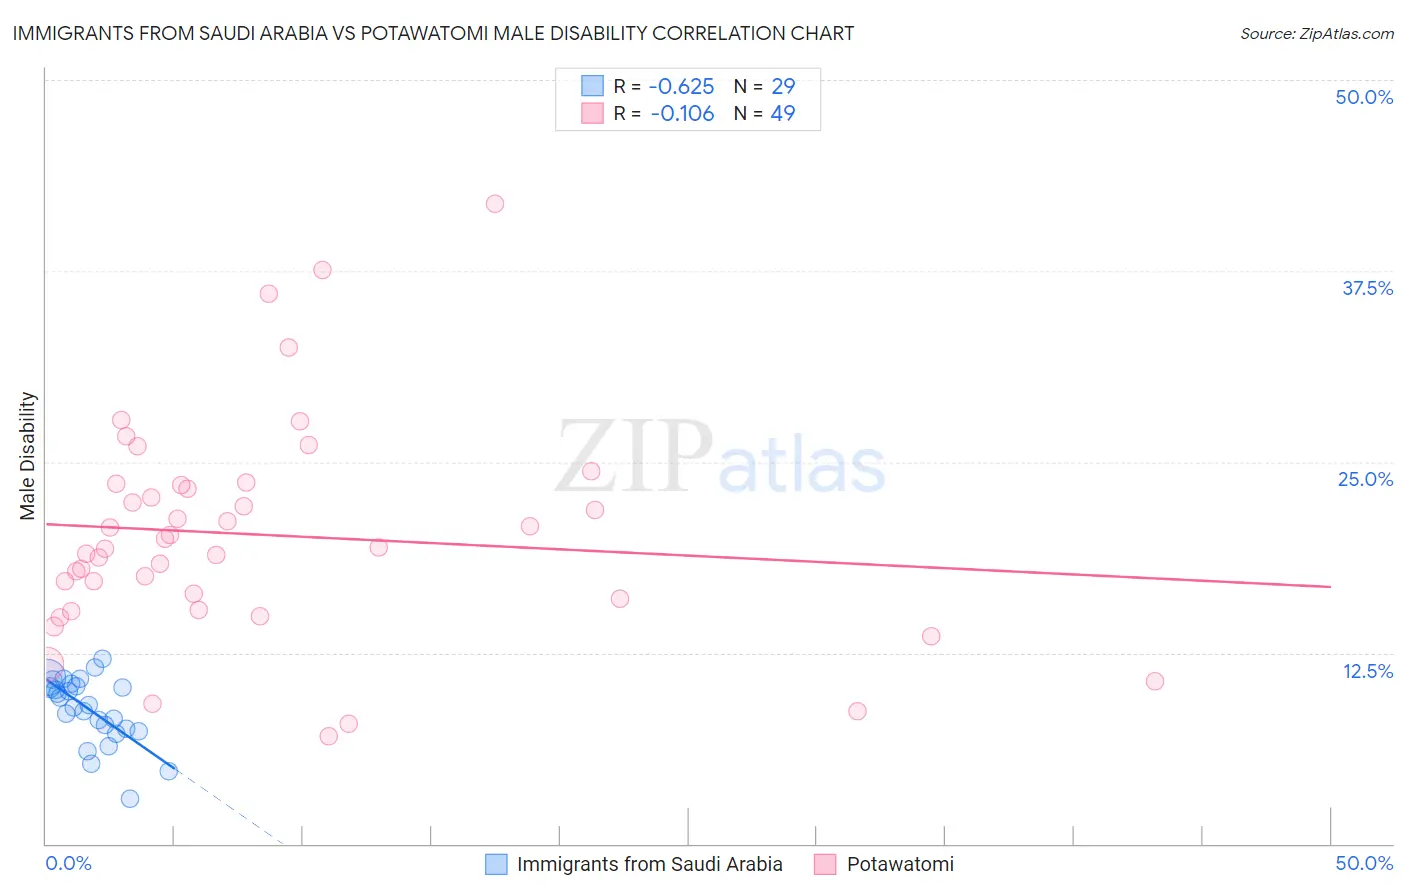
Immigrants from Saudi Arabia vs Potawatomi Male Disability Correlation Chart
The statistical analysis conducted on geographies consisting of 164,290,331 people shows a significant negative correlation between the proportion of Immigrants from Saudi Arabia and percentage of males with a disability in the United States with a correlation coefficient (R) of -0.625 and weighted average of 10.4%. Similarly, the statistical analysis conducted on geographies consisting of 117,764,083 people shows a poor negative correlation between the proportion of Potawatomi and percentage of males with a disability in the United States with a correlation coefficient (R) of -0.106 and weighted average of 14.2%, a difference of 37.2%.
Male Disability Correlation Summary
| Measurement | Immigrants from Saudi Arabia | Potawatomi |
| Minimum | 3.0% | 7.0% |
| Maximum | 12.2% | 41.9% |
| Range | 9.2% | 34.9% |
| Mean | 8.8% | 20.2% |
| Median | 9.1% | 19.4% |
| Interquartile 25% (IQ1) | 7.5% | 15.7% |
| Interquartile 75% (IQ3) | 10.4% | 23.5% |
| Interquartile Range (IQR) | 2.9% | 7.8% |
| Standard Deviation (Sample) | 2.2% | 7.2% |
| Standard Deviation (Population) | 2.1% | 7.1% |
Similar Demographics by Male Disability
Demographics Similar to Immigrants from Saudi Arabia by Male Disability
In terms of male disability, the demographic groups most similar to Immigrants from Saudi Arabia are Salvadoran (10.4%, a difference of 0.020%), Immigrants from Uzbekistan (10.4%, a difference of 0.020%), Peruvian (10.4%, a difference of 0.060%), Immigrants from Eritrea (10.4%, a difference of 0.080%), and Tongan (10.4%, a difference of 0.12%).
| Demographics | Rating | Rank | Male Disability |
| Turks | 99.7 /100 | #45 | Exceptional 10.3% |
| Cambodians | 99.7 /100 | #46 | Exceptional 10.3% |
| Immigrants | Peru | 99.7 /100 | #47 | Exceptional 10.3% |
| Israelis | 99.7 /100 | #48 | Exceptional 10.3% |
| Immigrants | Spain | 99.7 /100 | #49 | Exceptional 10.3% |
| South Americans | 99.6 /100 | #50 | Exceptional 10.3% |
| Salvadorans | 99.6 /100 | #51 | Exceptional 10.4% |
| Immigrants | Saudi Arabia | 99.6 /100 | #52 | Exceptional 10.4% |
| Immigrants | Uzbekistan | 99.6 /100 | #53 | Exceptional 10.4% |
| Peruvians | 99.6 /100 | #54 | Exceptional 10.4% |
| Immigrants | Eritrea | 99.6 /100 | #55 | Exceptional 10.4% |
| Tongans | 99.6 /100 | #56 | Exceptional 10.4% |
| Immigrants | South America | 99.6 /100 | #57 | Exceptional 10.4% |
| Immigrants | Japan | 99.5 /100 | #58 | Exceptional 10.4% |
| Immigrants | Australia | 99.5 /100 | #59 | Exceptional 10.4% |
Demographics Similar to Potawatomi by Male Disability
In terms of male disability, the demographic groups most similar to Potawatomi are Native/Alaskan (14.2%, a difference of 0.10%), Chippewa (14.3%, a difference of 0.43%), Cajun (14.4%, a difference of 1.0%), Ottawa (14.1%, a difference of 1.1%), and Comanche (14.1%, a difference of 1.1%).
| Demographics | Rating | Rank | Male Disability |
| Tlingit-Haida | 0.0 /100 | #320 | Tragic 13.8% |
| Shoshone | 0.0 /100 | #321 | Tragic 13.8% |
| Apache | 0.0 /100 | #322 | Tragic 14.0% |
| Osage | 0.0 /100 | #323 | Tragic 14.0% |
| Comanche | 0.0 /100 | #324 | Tragic 14.1% |
| Ottawa | 0.0 /100 | #325 | Tragic 14.1% |
| Natives/Alaskans | 0.0 /100 | #326 | Tragic 14.2% |
| Potawatomi | 0.0 /100 | #327 | Tragic 14.2% |
| Chippewa | 0.0 /100 | #328 | Tragic 14.3% |
| Cajuns | 0.0 /100 | #329 | Tragic 14.4% |
| Navajo | 0.0 /100 | #330 | Tragic 14.4% |
| Tohono O'odham | 0.0 /100 | #331 | Tragic 14.6% |
| Seminole | 0.0 /100 | #332 | Tragic 14.7% |
| Yuman | 0.0 /100 | #333 | Tragic 14.7% |
| Cherokee | 0.0 /100 | #334 | Tragic 14.8% |