Immigrants from Saudi Arabia vs Immigrants from Latin America Male Disability
COMPARE
Immigrants from Saudi Arabia
Immigrants from Latin America
Male Disability
Male Disability Comparison
Immigrants from Saudi Arabia
Immigrants from Latin America
10.4%
MALE DISABILITY
99.6/ 100
METRIC RATING
52nd/ 347
METRIC RANK
11.2%
MALE DISABILITY
54.0/ 100
METRIC RATING
168th/ 347
METRIC RANK
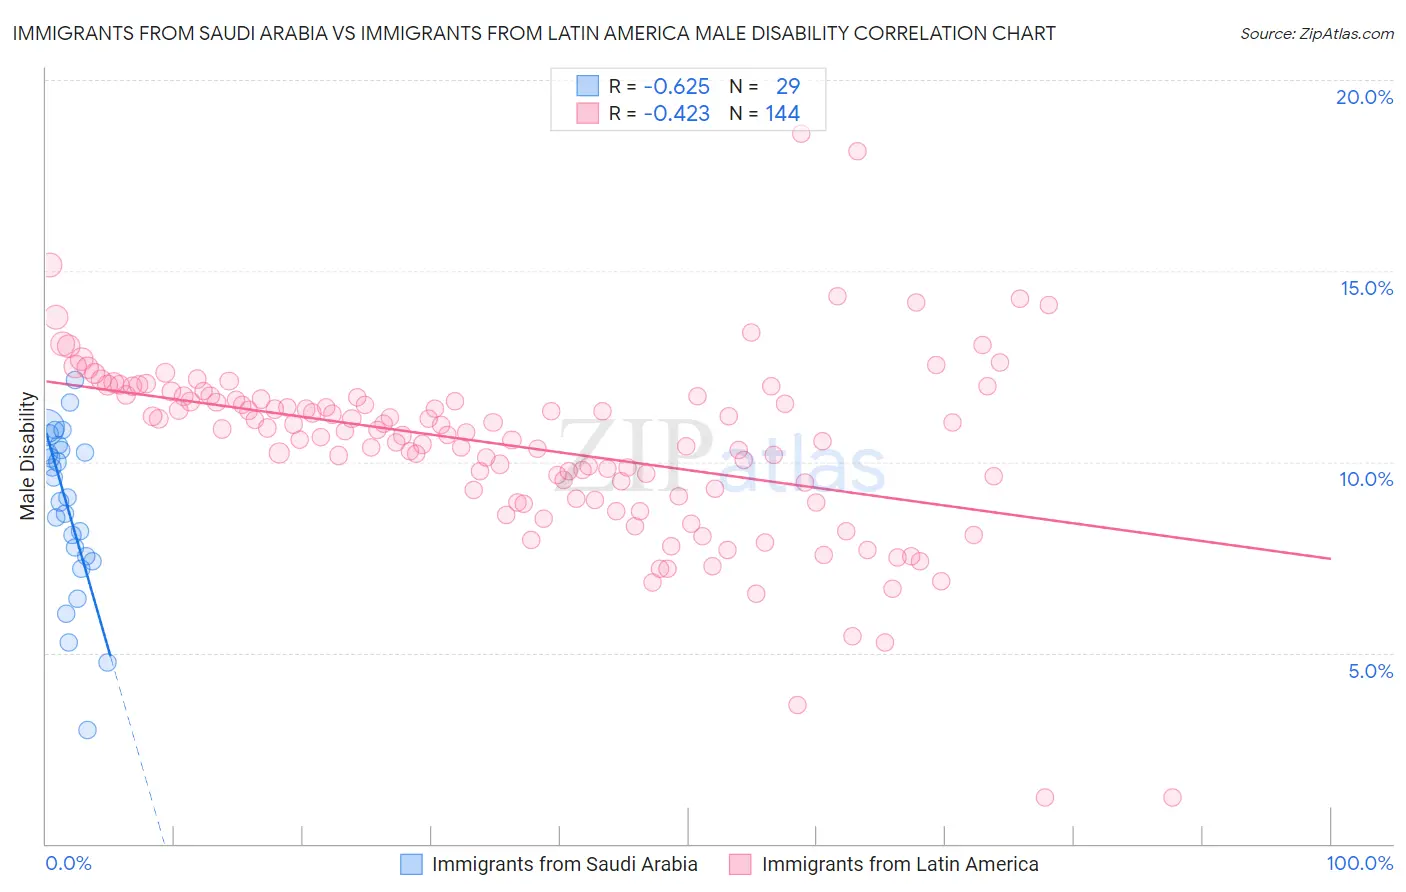
Immigrants from Saudi Arabia vs Immigrants from Latin America Male Disability Correlation Chart
The statistical analysis conducted on geographies consisting of 164,290,331 people shows a significant negative correlation between the proportion of Immigrants from Saudi Arabia and percentage of males with a disability in the United States with a correlation coefficient (R) of -0.625 and weighted average of 10.4%. Similarly, the statistical analysis conducted on geographies consisting of 558,326,856 people shows a moderate negative correlation between the proportion of Immigrants from Latin America and percentage of males with a disability in the United States with a correlation coefficient (R) of -0.423 and weighted average of 11.2%, a difference of 8.0%.
Male Disability Correlation Summary
| Measurement | Immigrants from Saudi Arabia | Immigrants from Latin America |
| Minimum | 3.0% | 1.2% |
| Maximum | 12.2% | 18.6% |
| Range | 9.2% | 17.4% |
| Mean | 8.8% | 10.4% |
| Median | 9.1% | 10.8% |
| Interquartile 25% (IQ1) | 7.5% | 9.2% |
| Interquartile 75% (IQ3) | 10.4% | 11.7% |
| Interquartile Range (IQR) | 2.9% | 2.5% |
| Standard Deviation (Sample) | 2.2% | 2.4% |
| Standard Deviation (Population) | 2.1% | 2.4% |
Similar Demographics by Male Disability
Demographics Similar to Immigrants from Saudi Arabia by Male Disability
In terms of male disability, the demographic groups most similar to Immigrants from Saudi Arabia are Salvadoran (10.4%, a difference of 0.020%), Immigrants from Uzbekistan (10.4%, a difference of 0.020%), Peruvian (10.4%, a difference of 0.060%), Immigrants from Eritrea (10.4%, a difference of 0.080%), and Tongan (10.4%, a difference of 0.12%).
| Demographics | Rating | Rank | Male Disability |
| Turks | 99.7 /100 | #45 | Exceptional 10.3% |
| Cambodians | 99.7 /100 | #46 | Exceptional 10.3% |
| Immigrants | Peru | 99.7 /100 | #47 | Exceptional 10.3% |
| Israelis | 99.7 /100 | #48 | Exceptional 10.3% |
| Immigrants | Spain | 99.7 /100 | #49 | Exceptional 10.3% |
| South Americans | 99.6 /100 | #50 | Exceptional 10.3% |
| Salvadorans | 99.6 /100 | #51 | Exceptional 10.4% |
| Immigrants | Saudi Arabia | 99.6 /100 | #52 | Exceptional 10.4% |
| Immigrants | Uzbekistan | 99.6 /100 | #53 | Exceptional 10.4% |
| Peruvians | 99.6 /100 | #54 | Exceptional 10.4% |
| Immigrants | Eritrea | 99.6 /100 | #55 | Exceptional 10.4% |
| Tongans | 99.6 /100 | #56 | Exceptional 10.4% |
| Immigrants | South America | 99.6 /100 | #57 | Exceptional 10.4% |
| Immigrants | Japan | 99.5 /100 | #58 | Exceptional 10.4% |
| Immigrants | Australia | 99.5 /100 | #59 | Exceptional 10.4% |
Demographics Similar to Immigrants from Latin America by Male Disability
In terms of male disability, the demographic groups most similar to Immigrants from Latin America are Immigrants from Southern Europe (11.2%, a difference of 0.020%), Barbadian (11.2%, a difference of 0.030%), New Zealander (11.2%, a difference of 0.060%), Haitian (11.2%, a difference of 0.080%), and Romanian (11.2%, a difference of 0.18%).
| Demographics | Rating | Rank | Male Disability |
| Immigrants | West Indies | 65.7 /100 | #161 | Good 11.1% |
| Immigrants | Haiti | 65.3 /100 | #162 | Good 11.1% |
| Immigrants | Kenya | 63.8 /100 | #163 | Good 11.1% |
| British West Indians | 62.8 /100 | #164 | Good 11.1% |
| Luxembourgers | 61.9 /100 | #165 | Good 11.1% |
| Immigrants | Hungary | 61.2 /100 | #166 | Good 11.1% |
| Immigrants | Southern Europe | 54.4 /100 | #167 | Average 11.2% |
| Immigrants | Latin America | 54.0 /100 | #168 | Average 11.2% |
| Barbadians | 53.4 /100 | #169 | Average 11.2% |
| New Zealanders | 52.9 /100 | #170 | Average 11.2% |
| Haitians | 52.5 /100 | #171 | Average 11.2% |
| Romanians | 50.7 /100 | #172 | Average 11.2% |
| Immigrants | Burma/Myanmar | 50.4 /100 | #173 | Average 11.2% |
| Maltese | 50.0 /100 | #174 | Average 11.2% |
| Immigrants | Honduras | 48.7 /100 | #175 | Average 11.2% |