Immigrants from Portugal vs Potawatomi Male Disability
COMPARE
Immigrants from Portugal
Potawatomi
Male Disability
Male Disability Comparison
Immigrants from Portugal
Potawatomi
12.3%
MALE DISABILITY
0.1/ 100
METRIC RATING
265th/ 347
METRIC RANK
14.2%
MALE DISABILITY
0.0/ 100
METRIC RATING
327th/ 347
METRIC RANK
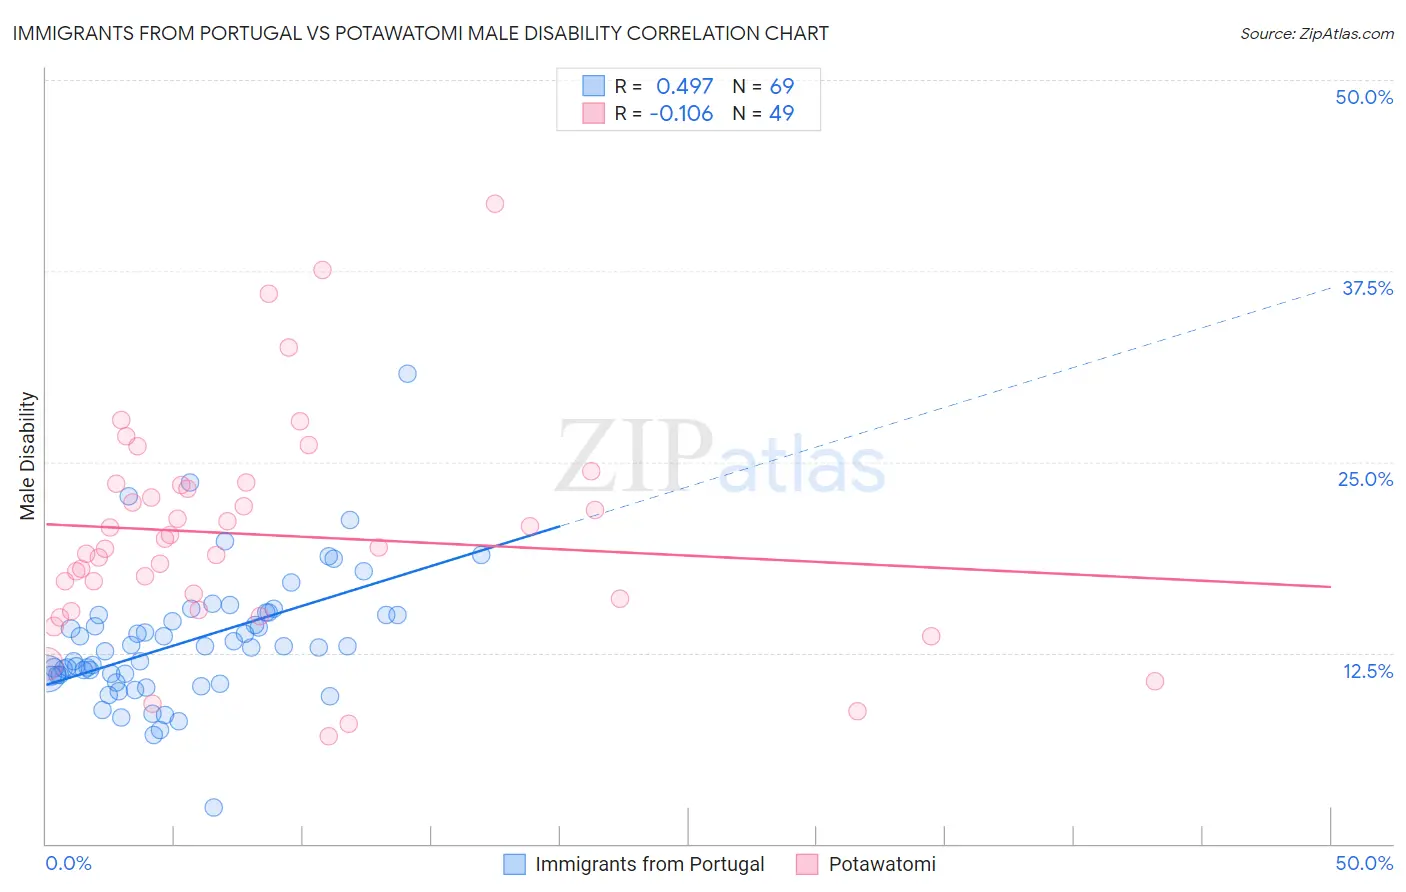
Immigrants from Portugal vs Potawatomi Male Disability Correlation Chart
The statistical analysis conducted on geographies consisting of 174,781,482 people shows a moderate positive correlation between the proportion of Immigrants from Portugal and percentage of males with a disability in the United States with a correlation coefficient (R) of 0.497 and weighted average of 12.3%. Similarly, the statistical analysis conducted on geographies consisting of 117,764,083 people shows a poor negative correlation between the proportion of Potawatomi and percentage of males with a disability in the United States with a correlation coefficient (R) of -0.106 and weighted average of 14.2%, a difference of 16.0%.
Male Disability Correlation Summary
| Measurement | Immigrants from Portugal | Potawatomi |
| Minimum | 2.4% | 7.0% |
| Maximum | 30.8% | 41.9% |
| Range | 28.4% | 34.9% |
| Mean | 13.2% | 20.2% |
| Median | 12.9% | 19.4% |
| Interquartile 25% (IQ1) | 11.0% | 15.7% |
| Interquartile 75% (IQ3) | 15.0% | 23.5% |
| Interquartile Range (IQR) | 3.9% | 7.8% |
| Standard Deviation (Sample) | 4.2% | 7.2% |
| Standard Deviation (Population) | 4.2% | 7.1% |
Similar Demographics by Male Disability
Demographics Similar to Immigrants from Portugal by Male Disability
In terms of male disability, the demographic groups most similar to Immigrants from Portugal are Hawaiian (12.3%, a difference of 0.020%), Immigrants from Germany (12.3%, a difference of 0.070%), Portuguese (12.3%, a difference of 0.19%), Czechoslovakian (12.3%, a difference of 0.19%), and Spaniard (12.3%, a difference of 0.28%).
| Demographics | Rating | Rank | Male Disability |
| Basques | 0.3 /100 | #258 | Tragic 12.1% |
| Belgians | 0.3 /100 | #259 | Tragic 12.1% |
| Swedes | 0.3 /100 | #260 | Tragic 12.1% |
| Slavs | 0.2 /100 | #261 | Tragic 12.2% |
| Norwegians | 0.2 /100 | #262 | Tragic 12.2% |
| Canadians | 0.2 /100 | #263 | Tragic 12.2% |
| Nepalese | 0.2 /100 | #264 | Tragic 12.2% |
| Immigrants | Portugal | 0.1 /100 | #265 | Tragic 12.3% |
| Hawaiians | 0.1 /100 | #266 | Tragic 12.3% |
| Immigrants | Germany | 0.1 /100 | #267 | Tragic 12.3% |
| Portuguese | 0.1 /100 | #268 | Tragic 12.3% |
| Czechoslovakians | 0.1 /100 | #269 | Tragic 12.3% |
| Spaniards | 0.1 /100 | #270 | Tragic 12.3% |
| Scandinavians | 0.1 /100 | #271 | Tragic 12.3% |
| Hmong | 0.0 /100 | #272 | Tragic 12.5% |
Demographics Similar to Potawatomi by Male Disability
In terms of male disability, the demographic groups most similar to Potawatomi are Native/Alaskan (14.2%, a difference of 0.10%), Chippewa (14.3%, a difference of 0.43%), Cajun (14.4%, a difference of 1.0%), Ottawa (14.1%, a difference of 1.1%), and Comanche (14.1%, a difference of 1.1%).
| Demographics | Rating | Rank | Male Disability |
| Tlingit-Haida | 0.0 /100 | #320 | Tragic 13.8% |
| Shoshone | 0.0 /100 | #321 | Tragic 13.8% |
| Apache | 0.0 /100 | #322 | Tragic 14.0% |
| Osage | 0.0 /100 | #323 | Tragic 14.0% |
| Comanche | 0.0 /100 | #324 | Tragic 14.1% |
| Ottawa | 0.0 /100 | #325 | Tragic 14.1% |
| Natives/Alaskans | 0.0 /100 | #326 | Tragic 14.2% |
| Potawatomi | 0.0 /100 | #327 | Tragic 14.2% |
| Chippewa | 0.0 /100 | #328 | Tragic 14.3% |
| Cajuns | 0.0 /100 | #329 | Tragic 14.4% |
| Navajo | 0.0 /100 | #330 | Tragic 14.4% |
| Tohono O'odham | 0.0 /100 | #331 | Tragic 14.6% |
| Seminole | 0.0 /100 | #332 | Tragic 14.7% |
| Yuman | 0.0 /100 | #333 | Tragic 14.7% |
| Cherokee | 0.0 /100 | #334 | Tragic 14.8% |