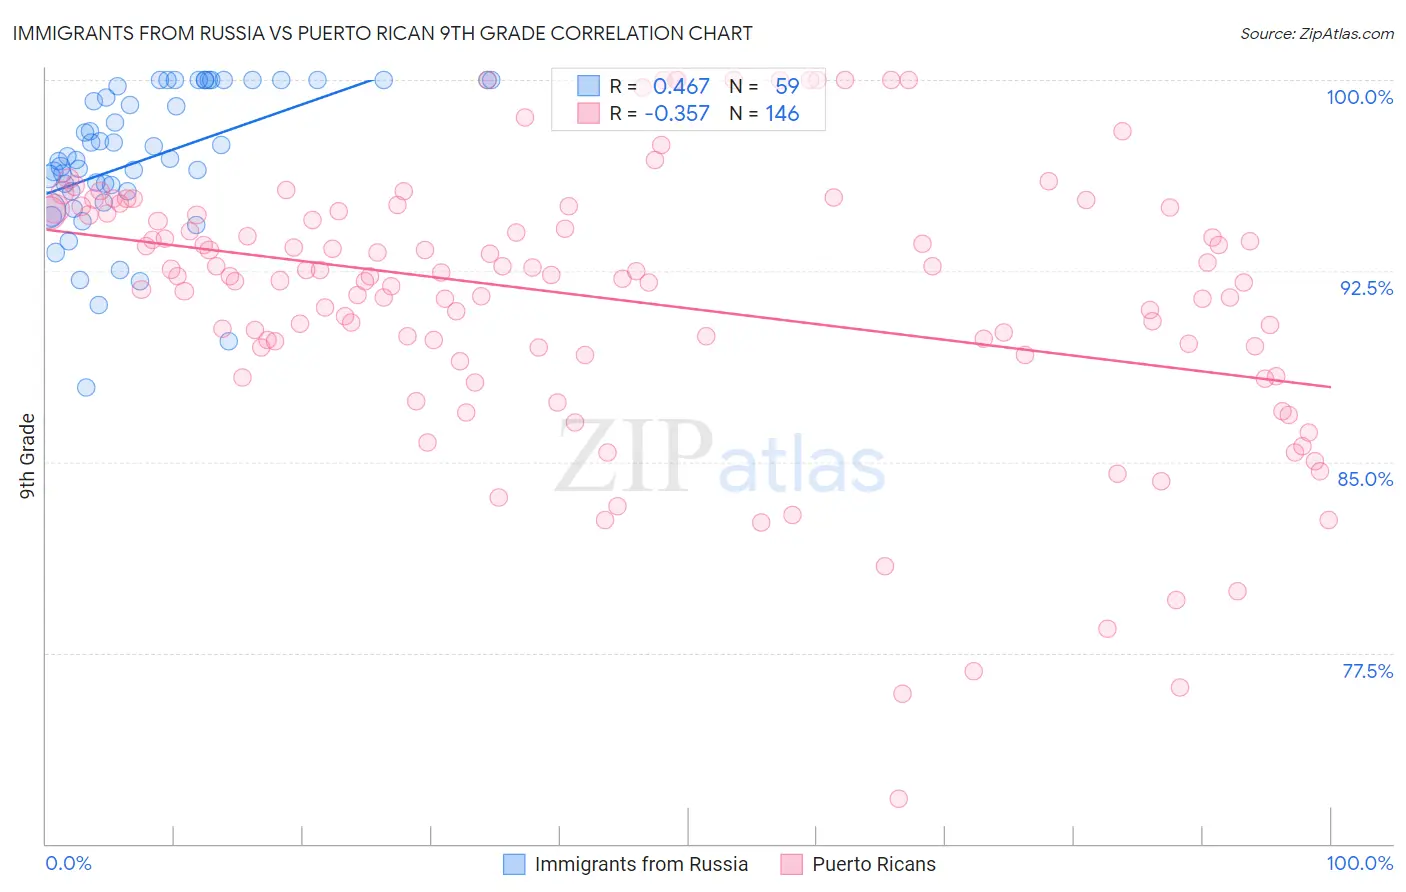
Immigrants from Russia vs Puerto Rican 9th Grade
COMPARE
Immigrants from Russia
Puerto Rican
9th Grade
9th Grade Comparison
Immigrants from Russia
Puerto Ricans
95.2%
9TH GRADE
86.6/ 100
METRIC RATING
138th/ 347
METRIC RANK
91.8%
9TH GRADE
0.0/ 100
METRIC RATING
323rd/ 347
METRIC RANK
Immigrants from Russia vs Puerto Rican 9th Grade Correlation Chart
The statistical analysis conducted on geographies consisting of 347,948,494 people shows a moderate positive correlation between the proportion of Immigrants from Russia and percentage of population with at least 9th grade education in the United States with a correlation coefficient (R) of 0.467 and weighted average of 95.2%. Similarly, the statistical analysis conducted on geographies consisting of 528,320,060 people shows a mild negative correlation between the proportion of Puerto Ricans and percentage of population with at least 9th grade education in the United States with a correlation coefficient (R) of -0.357 and weighted average of 91.8%, a difference of 3.7%.
9th Grade Correlation Summary
| Measurement | Immigrants from Russia | Puerto Rican |
| Minimum | 87.9% | 71.8% |
| Maximum | 100.0% | 100.0% |
| Range | 12.1% | 28.2% |
| Mean | 96.9% | 91.4% |
| Median | 96.9% | 92.3% |
| Interquartile 25% (IQ1) | 95.6% | 89.5% |
| Interquartile 75% (IQ3) | 100.0% | 94.8% |
| Interquartile Range (IQR) | 4.4% | 5.3% |
| Standard Deviation (Sample) | 2.8% | 5.3% |
| Standard Deviation (Population) | 2.8% | 5.3% |
Similar Demographics by 9th Grade
Demographics Similar to Immigrants from Russia by 9th Grade
In terms of 9th grade, the demographic groups most similar to Immigrants from Russia are Immigrants from Eastern Europe (95.2%, a difference of 0.010%), Hmong (95.2%, a difference of 0.020%), Immigrants from Taiwan (95.2%, a difference of 0.020%), Immigrants from Bosnia and Herzegovina (95.2%, a difference of 0.020%), and Immigrants from Iran (95.2%, a difference of 0.030%).
| Demographics | Rating | Rank | 9th Grade |
| Immigrants | North Macedonia | 92.3 /100 | #131 | Exceptional 95.3% |
| Immigrants | Nonimmigrants | 92.0 /100 | #132 | Exceptional 95.3% |
| Israelis | 90.4 /100 | #133 | Exceptional 95.3% |
| Immigrants | Israel | 89.6 /100 | #134 | Excellent 95.3% |
| Immigrants | Belarus | 88.9 /100 | #135 | Excellent 95.2% |
| Immigrants | Iran | 88.3 /100 | #136 | Excellent 95.2% |
| Hmong | 87.7 /100 | #137 | Excellent 95.2% |
| Immigrants | Russia | 86.6 /100 | #138 | Excellent 95.2% |
| Immigrants | Eastern Europe | 85.8 /100 | #139 | Excellent 95.2% |
| Immigrants | Taiwan | 85.3 /100 | #140 | Excellent 95.2% |
| Immigrants | Bosnia and Herzegovina | 85.2 /100 | #141 | Excellent 95.2% |
| Immigrants | Greece | 84.6 /100 | #142 | Excellent 95.2% |
| Spanish | 84.4 /100 | #143 | Excellent 95.2% |
| Yup'ik | 83.3 /100 | #144 | Excellent 95.2% |
| Pueblo | 82.2 /100 | #145 | Excellent 95.1% |
Demographics Similar to Puerto Ricans by 9th Grade
In terms of 9th grade, the demographic groups most similar to Puerto Ricans are Belizean (91.8%, a difference of 0.0%), Immigrants from Ecuador (91.8%, a difference of 0.030%), Immigrants from Belize (91.8%, a difference of 0.060%), Nicaraguan (91.9%, a difference of 0.090%), and Ecuadorian (91.9%, a difference of 0.14%).
| Demographics | Rating | Rank | 9th Grade |
| Cape Verdeans | 0.0 /100 | #316 | Tragic 92.2% |
| Immigrants | Cuba | 0.0 /100 | #317 | Tragic 92.2% |
| Nepalese | 0.0 /100 | #318 | Tragic 92.0% |
| Ecuadorians | 0.0 /100 | #319 | Tragic 91.9% |
| Nicaraguans | 0.0 /100 | #320 | Tragic 91.9% |
| Immigrants | Ecuador | 0.0 /100 | #321 | Tragic 91.8% |
| Belizeans | 0.0 /100 | #322 | Tragic 91.8% |
| Puerto Ricans | 0.0 /100 | #323 | Tragic 91.8% |
| Immigrants | Belize | 0.0 /100 | #324 | Tragic 91.8% |
| Central American Indians | 0.0 /100 | #325 | Tragic 91.5% |
| Immigrants | Armenia | 0.0 /100 | #326 | Tragic 91.4% |
| Immigrants | Nicaragua | 0.0 /100 | #327 | Tragic 91.3% |
| Dominicans | 0.0 /100 | #328 | Tragic 91.1% |
| Hondurans | 0.0 /100 | #329 | Tragic 91.0% |
| Immigrants | Cabo Verde | 0.0 /100 | #330 | Tragic 90.9% |