Immigrants from Romania vs Somali Single Father Poverty

COMPARE

Immigrants from Romania
Race
Ancestry
AfghanAfricanAlaska NativeAlaskan AthabascanAlbanianAleutAlsatianAmericanApacheArabArapahoArgentineanArmenianAssyrian/Chaldean/SyriacAustralianAustrianBahamianBangladeshiBarbadianBasqueBelgianBelizeanBermudanBhutaneseBlackfeetBolivianBrazilianBritishBritish West IndianBulgarianBurmeseCajunCambodianCanadianCape VerdeanCarpatho RusynCelticCentral AmericanCentral American IndianCherokeeCheyenneChickasawChileanChineseChippewaChoctawColombianColvilleComancheCosta RicanCreeCreekCroatianCrowCubanCypriotCzechCzechoslovakianDanishDelawareDominicanDutchDutch West IndianEastern EuropeanEcuadorianEgyptianEnglishEstonianEthiopianEuropeanFijianFilipinoFinnishFrenchFrench American IndianFrench CanadianGermanGerman RussianGhanaianGreekGuamanian/ChamorroGuatemalanGuyaneseHaitianHmongHonduranHopiHoumaHungarianIcelanderIndian (Asian)IndonesianInupiatIranianIraqiIrishIroquoisIsraeliItalianJamaicanJapaneseJordanianKenyanKiowaKoreanLaotianLatvianLebaneseLiberianLithuanianLumbeeLuxembourgerMacedonianMalaysianMalteseMarshalleseMenomineeMexicanMexican American IndianMongolianMoroccanNative HawaiianNavajoNepaleseNew ZealanderNicaraguanNigerianNorthern EuropeanNorwegianOkinawanOsageOttawaPaiutePakistaniPalestinianPanamanianParaguayanPennsylvania GermanPeruvianPimaPolishPortuguesePotawatomiPuebloPuerto RicanPuget Sound SalishRomanianRussianSalvadoranSamoanScandinavianScotch-IrishScottishSeminoleSenegaleseSerbianShoshoneSierra LeoneanSiouxSlavicSlovakSloveneSouth AfricanSouth AmericanSouth American IndianSoviet UnionSpaniardSpanishSpanish AmericanSpanish American IndianSri LankanSubsaharan AfricanSudaneseSwedishSwissSyrianTaiwaneseThaiTlingit-HaidaTohono O'OdhamTonganTrinidadian and TobagonianTsimshianTurkishU.S. Virgin IslanderUgandanUkrainianUruguayanUteVenezuelanVietnameseWelshWest IndianYakamaYaquiYugoslavianYumanYup'ikZimbabwean
Immigration
NonimmigrantsImmigrantsAfghanistanAfricaAlbaniaArgentinaArmeniaAsiaAustraliaAustriaBahamasBangladeshBarbadosBelarusBelgiumBelizeBoliviaBosnia and HerzegovinaBrazilBulgariaBurma/MyanmarCabo VerdeCambodiaCameroonCanadaCaribbeanCentral AmericaChileChinaColombiaCongoCosta RicaCroatiaCubaCzechoslovakiaDenmarkDominicaDominican RepublicEastern AfricaEastern AsiaEastern EuropeEcuadorEgyptEl SalvadorEnglandEritreaEthiopiaEuropeFijiFranceGermanyGhanaGreeceGrenadaGuatemalaGuyanaHaitiHondurasHong KongHungaryIndiaIndonesiaIranIraqIrelandIsraelItalyJamaicaJapanJordanKazakhstanKenyaKoreaKuwaitLaosLatin AmericaLatviaLebanonLiberiaLithuaniaMalaysiaMexicoMicronesiaMiddle AfricaMoldovaMoroccoNepalNetherlandsNicaraguaNigeriaNorth AmericaNorth MacedoniaNorthern AfricaNorthern EuropeNorwayOceaniaPakistanPanamaPeruPhilippinesPolandPortugalRomaniaRussiaSaudi ArabiaScotlandSenegalSerbiaSierra LeoneSingaporeSomaliaSouth AfricaSouth AmericaSouth Central AsiaSouth Eastern AsiaSouthern EuropeSpainSri LankaSt. Vincent and the GrenadinesSudanSwedenSwitzerlandSyriaTaiwanThailandTrinidad and TobagoTurkeyUgandaUkraineUruguayUzbekistanVenezuelaVietnamWest IndiesWestern AfricaWestern AsiaWestern EuropeYemenZaireZimbabweAzores
Somali
Race
Ancestry
AfghanAfricanAlaska NativeAlaskan AthabascanAlbanianAleutAlsatianAmericanApacheArabArapahoArgentineanArmenianAssyrian/Chaldean/SyriacAustralianAustrianBahamianBangladeshiBarbadianBasqueBelgianBelizeanBermudanBhutaneseBlackfeetBolivianBrazilianBritishBritish West IndianBulgarianBurmeseCajunCambodianCanadianCape VerdeanCarpatho RusynCelticCentral AmericanCentral American IndianCherokeeCheyenneChickasawChileanChineseChippewaChoctawColombianColvilleComancheCosta RicanCreeCreekCroatianCrowCubanCypriotCzechCzechoslovakianDanishDelawareDominicanDutchDutch West IndianEastern EuropeanEcuadorianEgyptianEnglishEstonianEthiopianEuropeanFijianFilipinoFinnishFrenchFrench American IndianFrench CanadianGermanGerman RussianGhanaianGreekGuamanian/ChamorroGuatemalanGuyaneseHaitianHmongHonduranHopiHoumaHungarianIcelanderIndian (Asian)IndonesianInupiatIranianIraqiIrishIroquoisIsraeliItalianJamaicanJapaneseJordanianKenyanKiowaKoreanLaotianLatvianLebaneseLiberianLithuanianLumbeeLuxembourgerMacedonianMalaysianMalteseMarshalleseMenomineeMexicanMexican American IndianMongolianMoroccanNative HawaiianNavajoNepaleseNew ZealanderNicaraguanNigerianNorthern EuropeanNorwegianOkinawanOsageOttawaPaiutePakistaniPalestinianPanamanianParaguayanPennsylvania GermanPeruvianPimaPolishPortuguesePotawatomiPuebloPuerto RicanPuget Sound SalishRomanianRussianSalvadoranSamoanScandinavianScotch-IrishScottishSeminoleSenegaleseSerbianShoshoneSierra LeoneanSiouxSlavicSlovakSloveneSomaliSouth AfricanSouth AmericanSouth American IndianSoviet UnionSpaniardSpanishSpanish AmericanSpanish American IndianSri LankanSubsaharan AfricanSudaneseSwedishSwissSyrianTaiwaneseThaiTlingit-HaidaTohono O'OdhamTonganTrinidadian and TobagonianTsimshianTurkishU.S. Virgin IslanderUgandanUkrainianUruguayanUteVenezuelanVietnameseWelshWest IndianYakamaYaquiYugoslavianYumanYup'ikZimbabwean
Immigration
NonimmigrantsImmigrantsAfghanistanAfricaAlbaniaArgentinaArmeniaAsiaAustraliaAustriaBahamasBangladeshBarbadosBelarusBelgiumBelizeBoliviaBosnia and HerzegovinaBrazilBulgariaBurma/MyanmarCabo VerdeCambodiaCameroonCanadaCaribbeanCentral AmericaChileChinaColombiaCongoCosta RicaCroatiaCubaCzechoslovakiaDenmarkDominicaDominican RepublicEastern AfricaEastern AsiaEastern EuropeEcuadorEgyptEl SalvadorEnglandEritreaEthiopiaEuropeFijiFranceGermanyGhanaGreeceGrenadaGuatemalaGuyanaHaitiHondurasHong KongHungaryIndiaIndonesiaIranIraqIrelandIsraelItalyJamaicaJapanJordanKazakhstanKenyaKoreaKuwaitLaosLatin AmericaLatviaLebanonLiberiaLithuaniaMalaysiaMexicoMicronesiaMiddle AfricaMoldovaMoroccoNepalNetherlandsNicaraguaNigeriaNorth AmericaNorth MacedoniaNorthern AfricaNorthern EuropeNorwayOceaniaPakistanPanamaPeruPhilippinesPolandPortugalRussiaSaudi ArabiaScotlandSenegalSerbiaSierra LeoneSingaporeSomaliaSouth AfricaSouth AmericaSouth Central AsiaSouth Eastern AsiaSouthern EuropeSpainSri LankaSt. Vincent and the GrenadinesSudanSwedenSwitzerlandSyriaTaiwanThailandTrinidad and TobagoTurkeyUgandaUkraineUruguayUzbekistanVenezuelaVietnamWest IndiesWestern AfricaWestern AsiaWestern EuropeYemenZaireZimbabweAzores
Single Father Poverty
Income
Poverty
Unemployment
Labor Participation
Family Structure
Vehicle Availability
Education Level
Disability

Single Father Poverty Comparison

Immigrants from Romania

Somalis

Exceptional
Exceptional
15.5%
SINGLE FATHER POVERTY
98.6/ 100
METRIC RATING
91st/ 347
METRIC RANK
14.5%
SINGLE FATHER POVERTY
100.0/ 100
METRIC RATING
29th/ 347
METRIC RANK

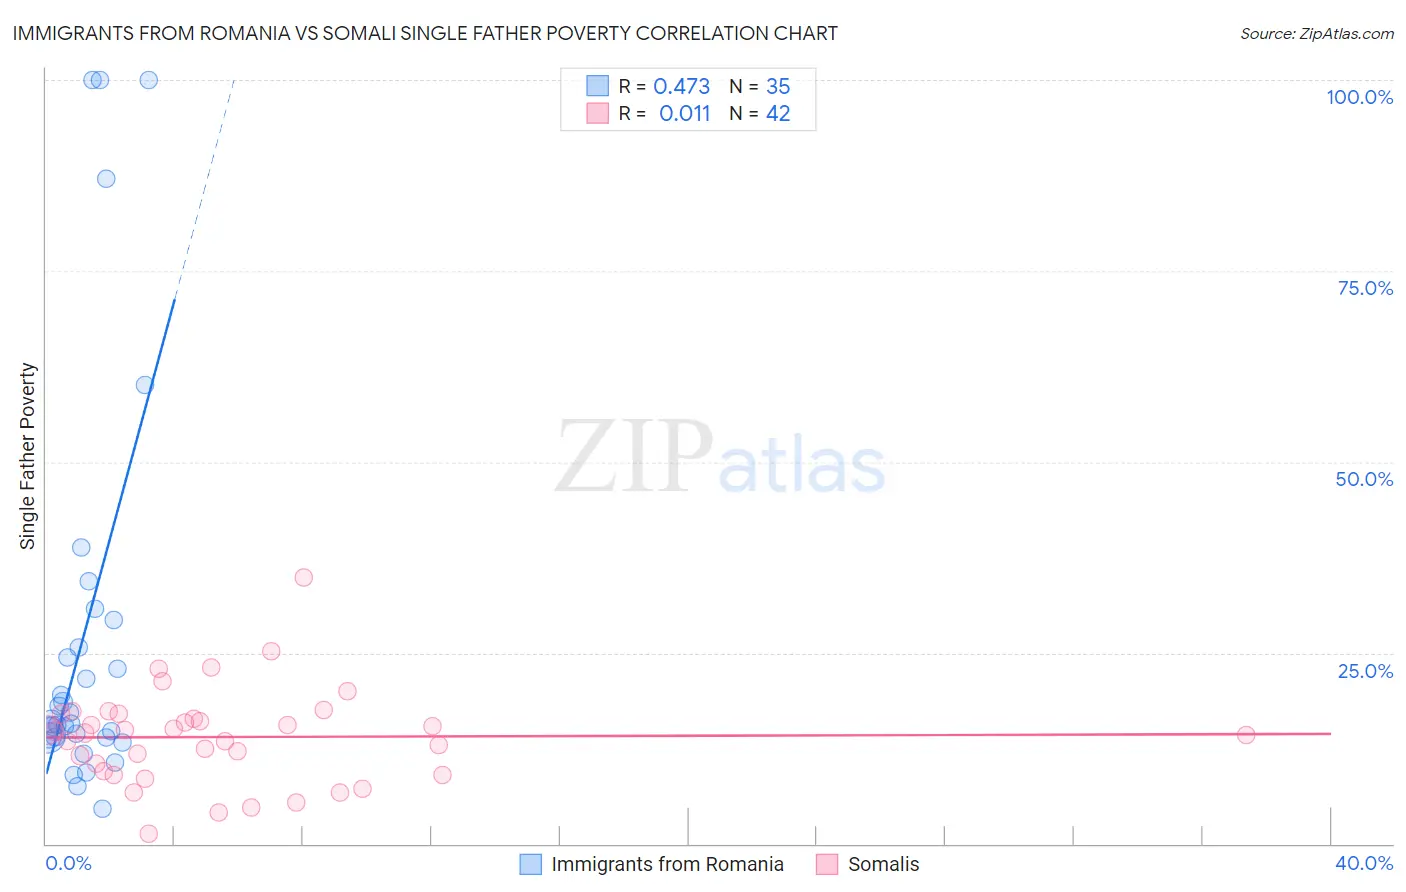
Immigrants from Romania vs Somali Single Father Poverty Correlation Chart

The statistical analysis conducted on geographies consisting of 209,903,487 people shows a moderate positive correlation between the proportion of Immigrants from Romania and poverty level among single fathers in the United States with a correlation coefficient (R) of 0.473 and weighted average of 15.5%. Similarly, the statistical analysis conducted on geographies consisting of 90,638,192 people shows no correlation between the proportion of Somalis and poverty level among single fathers in the United States with a correlation coefficient (R) of 0.011 and weighted average of 14.5%, a difference of 6.9%.
Immigrants from Romania vs Somali Single Father Poverty

Single Father Poverty Correlation Summary

MeasurementImmigrants from RomaniaSomali
Minimum4.5%1.3%
Maximum100.0%34.8%
Range95.5%33.5%
Mean27.9%14.0%
Median16.0%14.6%
Interquartile 25% (IQ1)13.9%9.5%
Interquartile 75% (IQ3)29.3%16.9%
Interquartile Range (IQR)15.3%7.4%
Standard Deviation (Sample)27.1%6.2%
Standard Deviation (Population)26.8%6.1%

Similar Demographics by Single Father Poverty

Demographics Similar to Immigrants from Romania by Single Father Poverty

In terms of single father poverty, the demographic groups most similar to Immigrants from Romania are Mexican American Indian (15.5%, a difference of 0.10%), Immigrants from Serbia (15.5%, a difference of 0.11%), Basque (15.5%, a difference of 0.15%), Immigrants from Uruguay (15.6%, a difference of 0.29%), and Immigrants from Korea (15.5%, a difference of 0.34%).
DemographicsRating | RankSingle Father Poverty
Peruvians
99.2
/100
|
#84
Exceptional
15.4%
Immigrants | Oceania
99.1
/100
|
#85
Exceptional
15.4%
Immigrants | Russia
99.0
/100
|
#86
Exceptional
15.5%
Brazilians
99.0
/100
|
#87
Exceptional
15.5%
Burmese
99.0
/100
|
#88
Exceptional
15.5%
Immigrants | Korea
99.0
/100
|
#89
Exceptional
15.5%
Mexican American Indians
98.7
/100
|
#90
Exceptional
15.5%
Immigrants | Romania
98.6
/100
|
#91
Exceptional
15.5%
Immigrants | Serbia
98.5
/100
|
#92
Exceptional
15.5%
Basques
98.4
/100
|
#93
Exceptional
15.5%
Immigrants | Uruguay
98.2
/100
|
#94
Exceptional
15.6%
Immigrants | Kazakhstan
98.2
/100
|
#95
Exceptional
15.6%
Immigrants | Belgium
98.1
/100
|
#96
Exceptional
15.6%
Yaqui
98.1
/100
|
#97
Exceptional
15.6%
Zimbabweans
98.1
/100
|
#98
Exceptional
15.6%

Demographics Similar to Somalis by Single Father Poverty

In terms of single father poverty, the demographic groups most similar to Somalis are Thai (14.5%, a difference of 0.040%), Immigrants from South Central Asia (14.5%, a difference of 0.11%), Icelander (14.5%, a difference of 0.13%), Asian (14.6%, a difference of 0.28%), and Nepalese (14.4%, a difference of 0.64%).
DemographicsRating | RankSingle Father Poverty
Taiwanese
100.0
/100
|
#22
Exceptional
14.3%
Immigrants | Egypt
100.0
/100
|
#23
Exceptional
14.4%
Immigrants | South Eastern Asia
100.0
/100
|
#24
Exceptional
14.4%
Iranians
100.0
/100
|
#25
Exceptional
14.4%
Spanish American Indians
100.0
/100
|
#26
Exceptional
14.4%
Nepalese
100.0
/100
|
#27
Exceptional
14.4%
Immigrants | South Central Asia
100.0
/100
|
#28
Exceptional
14.5%
Somalis
100.0
/100
|
#29
Exceptional
14.5%
Thais
100.0
/100
|
#30
Exceptional
14.5%
Icelanders
100.0
/100
|
#31
Exceptional
14.5%
Asians
100.0
/100
|
#32
Exceptional
14.6%
Okinawans
100.0
/100
|
#33
Exceptional
14.6%
Egyptians
100.0
/100
|
#34
Exceptional
14.7%
Immigrants | Bolivia
100.0
/100
|
#35
Exceptional
14.7%
Immigrants | Indonesia
100.0
/100
|
#36
Exceptional
14.7%