Immigrants from Poland vs Ute Ambulatory Disability
COMPARE
Immigrants from Poland
Ute
Ambulatory Disability
Ambulatory Disability Comparison
Immigrants from Poland
Ute
5.9%
AMBULATORY DISABILITY
95.4/ 100
METRIC RATING
114th/ 347
METRIC RANK
6.0%
AMBULATORY DISABILITY
86.6/ 100
METRIC RATING
134th/ 347
METRIC RANK
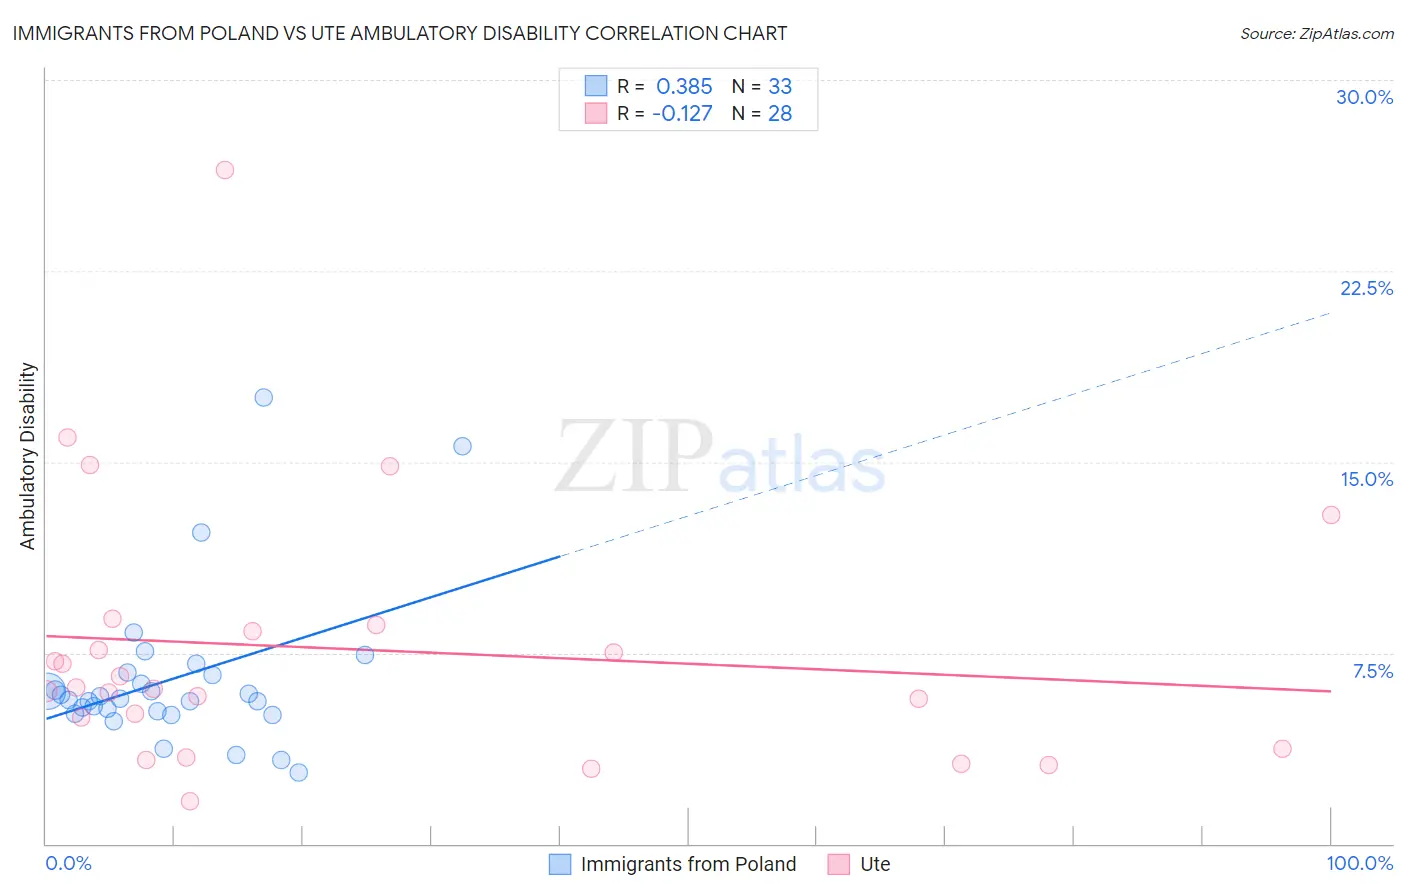
Immigrants from Poland vs Ute Ambulatory Disability Correlation Chart
The statistical analysis conducted on geographies consisting of 304,808,570 people shows a mild positive correlation between the proportion of Immigrants from Poland and percentage of population with ambulatory disability in the United States with a correlation coefficient (R) of 0.385 and weighted average of 5.9%. Similarly, the statistical analysis conducted on geographies consisting of 55,667,207 people shows a poor negative correlation between the proportion of Ute and percentage of population with ambulatory disability in the United States with a correlation coefficient (R) of -0.127 and weighted average of 6.0%, a difference of 1.6%.
Ambulatory Disability Correlation Summary
| Measurement | Immigrants from Poland | Ute |
| Minimum | 2.8% | 1.7% |
| Maximum | 17.5% | 26.5% |
| Range | 14.7% | 24.8% |
| Mean | 6.5% | 7.6% |
| Median | 5.7% | 6.1% |
| Interquartile 25% (IQ1) | 5.2% | 4.3% |
| Interquartile 75% (IQ3) | 6.7% | 8.5% |
| Interquartile Range (IQR) | 1.5% | 4.1% |
| Standard Deviation (Sample) | 3.1% | 5.2% |
| Standard Deviation (Population) | 3.0% | 5.1% |
Demographics Similar to Immigrants from Poland and Ute by Ambulatory Disability
In terms of ambulatory disability, the demographic groups most similar to Immigrants from Poland are South American Indian (5.9%, a difference of 0.21%), Immigrants from Africa (5.9%, a difference of 0.22%), Immigrants from South Eastern Asia (5.9%, a difference of 0.50%), Russian (5.9%, a difference of 0.54%), and Norwegian (5.9%, a difference of 0.61%). Similarly, the demographic groups most similar to Ute are Immigrants (6.0%, a difference of 0.040%), Immigrants from Europe (6.0%, a difference of 0.15%), Immigrants from Costa Rica (5.9%, a difference of 0.39%), Immigrants from Kazakhstan (5.9%, a difference of 0.42%), and Immigrants from Norway (5.9%, a difference of 0.53%).
| Demographics | Rating | Rank | Ambulatory Disability |
| Immigrants | Poland | 95.4 /100 | #114 | Exceptional 5.9% |
| South American Indians | 94.8 /100 | #115 | Exceptional 5.9% |
| Immigrants | Africa | 94.7 /100 | #116 | Exceptional 5.9% |
| Immigrants | South Eastern Asia | 93.6 /100 | #117 | Exceptional 5.9% |
| Russians | 93.4 /100 | #118 | Exceptional 5.9% |
| Norwegians | 93.1 /100 | #119 | Exceptional 5.9% |
| Estonians | 92.9 /100 | #120 | Exceptional 5.9% |
| Costa Ricans | 92.6 /100 | #121 | Exceptional 5.9% |
| Icelanders | 92.6 /100 | #122 | Exceptional 5.9% |
| Immigrants | Russia | 92.4 /100 | #123 | Exceptional 5.9% |
| Immigrants | Middle Africa | 92.2 /100 | #124 | Exceptional 5.9% |
| Koreans | 91.6 /100 | #125 | Exceptional 5.9% |
| Arabs | 91.5 /100 | #126 | Exceptional 5.9% |
| Immigrants | Nigeria | 90.9 /100 | #127 | Exceptional 5.9% |
| Immigrants | Western Asia | 90.7 /100 | #128 | Exceptional 5.9% |
| Immigrants | Norway | 90.5 /100 | #129 | Exceptional 5.9% |
| Immigrants | Kazakhstan | 89.7 /100 | #130 | Excellent 5.9% |
| Immigrants | Costa Rica | 89.5 /100 | #131 | Excellent 5.9% |
| Immigrants | Europe | 87.8 /100 | #132 | Excellent 6.0% |
| Immigrants | Immigrants | 86.9 /100 | #133 | Excellent 6.0% |
| Ute | 86.6 /100 | #134 | Excellent 6.0% |