Immigrants from Philippines vs Immigrants from Turkey Disability Age 65 to 74

COMPARE

Immigrants from Philippines
Race
Ancestry
AfghanAfricanAlaska NativeAlaskan AthabascanAlbanianAleutAlsatianAmericanApacheArabArapahoArgentineanArmenianAssyrian/Chaldean/SyriacAustralianAustrianBahamianBangladeshiBarbadianBasqueBelgianBelizeanBermudanBhutaneseBlackfeetBolivianBrazilianBritishBritish West IndianBulgarianBurmeseCajunCambodianCanadianCape VerdeanCarpatho RusynCelticCentral AmericanCentral American IndianCherokeeCheyenneChickasawChileanChineseChippewaChoctawColombianColvilleComancheCosta RicanCreeCreekCroatianCrowCubanCypriotCzechCzechoslovakianDanishDelawareDominicanDutchDutch West IndianEastern EuropeanEcuadorianEgyptianEnglishEstonianEthiopianEuropeanFijianFilipinoFinnishFrenchFrench American IndianFrench CanadianGermanGerman RussianGhanaianGreekGuamanian/ChamorroGuatemalanGuyaneseHaitianHmongHonduranHopiHoumaHungarianIcelanderIndian (Asian)IndonesianInupiatIranianIraqiIrishIroquoisIsraeliItalianJamaicanJapaneseJordanianKenyanKiowaKoreanLaotianLatvianLebaneseLiberianLithuanianLumbeeLuxembourgerMacedonianMalaysianMalteseMarshalleseMenomineeMexicanMexican American IndianMongolianMoroccanNative HawaiianNavajoNepaleseNew ZealanderNicaraguanNigerianNorthern EuropeanNorwegianOkinawanOsageOttawaPaiutePakistaniPalestinianPanamanianParaguayanPennsylvania GermanPeruvianPimaPolishPortuguesePotawatomiPuebloPuerto RicanPuget Sound SalishRomanianRussianSalvadoranSamoanScandinavianScotch-IrishScottishSeminoleSenegaleseSerbianShoshoneSierra LeoneanSiouxSlavicSlovakSloveneSomaliSouth AfricanSouth AmericanSouth American IndianSoviet UnionSpaniardSpanishSpanish AmericanSpanish American IndianSri LankanSubsaharan AfricanSudaneseSwedishSwissSyrianTaiwaneseThaiTlingit-HaidaTohono O'OdhamTonganTrinidadian and TobagonianTsimshianTurkishU.S. Virgin IslanderUgandanUkrainianUruguayanUteVenezuelanVietnameseWelshWest IndianYakamaYaquiYugoslavianYumanYup'ikZimbabwean
Immigration
NonimmigrantsImmigrantsAfghanistanAfricaAlbaniaArgentinaArmeniaAsiaAustraliaAustriaBahamasBangladeshBarbadosBelarusBelgiumBelizeBoliviaBosnia and HerzegovinaBrazilBulgariaBurma/MyanmarCabo VerdeCambodiaCameroonCanadaCaribbeanCentral AmericaChileChinaColombiaCongoCosta RicaCroatiaCubaCzechoslovakiaDenmarkDominicaDominican RepublicEastern AfricaEastern AsiaEastern EuropeEcuadorEgyptEl SalvadorEnglandEritreaEthiopiaEuropeFijiFranceGermanyGhanaGreeceGrenadaGuatemalaGuyanaHaitiHondurasHong KongHungaryIndiaIndonesiaIranIraqIrelandIsraelItalyJamaicaJapanJordanKazakhstanKenyaKoreaKuwaitLaosLatin AmericaLatviaLebanonLiberiaLithuaniaMalaysiaMexicoMicronesiaMiddle AfricaMoldovaMoroccoNepalNetherlandsNicaraguaNigeriaNorth AmericaNorth MacedoniaNorthern AfricaNorthern EuropeNorwayOceaniaPakistanPanamaPeruPhilippinesPolandPortugalRomaniaRussiaSaudi ArabiaScotlandSenegalSerbiaSierra LeoneSingaporeSomaliaSouth AfricaSouth AmericaSouth Central AsiaSouth Eastern AsiaSouthern EuropeSpainSri LankaSt. Vincent and the GrenadinesSudanSwedenSwitzerlandSyriaTaiwanThailandTrinidad and TobagoUgandaUkraineUruguayUzbekistanVenezuelaVietnamWest IndiesWestern AfricaWestern AsiaWestern EuropeYemenZaireZimbabweAzores
Immigrants from Turkey
Race
Ancestry
AfghanAfricanAlaska NativeAlaskan AthabascanAlbanianAleutAlsatianAmericanApacheArabArapahoArgentineanArmenianAssyrian/Chaldean/SyriacAustralianAustrianBahamianBangladeshiBarbadianBasqueBelgianBelizeanBermudanBhutaneseBlackfeetBolivianBrazilianBritishBritish West IndianBulgarianBurmeseCajunCambodianCanadianCape VerdeanCarpatho RusynCelticCentral AmericanCentral American IndianCherokeeCheyenneChickasawChileanChineseChippewaChoctawColombianColvilleComancheCosta RicanCreeCreekCroatianCrowCubanCypriotCzechCzechoslovakianDanishDelawareDominicanDutchDutch West IndianEastern EuropeanEcuadorianEgyptianEnglishEstonianEthiopianEuropeanFijianFilipinoFinnishFrenchFrench American IndianFrench CanadianGermanGerman RussianGhanaianGreekGuamanian/ChamorroGuatemalanGuyaneseHaitianHmongHonduranHopiHoumaHungarianIcelanderIndian (Asian)IndonesianInupiatIranianIraqiIrishIroquoisIsraeliItalianJamaicanJapaneseJordanianKenyanKiowaKoreanLaotianLatvianLebaneseLiberianLithuanianLumbeeLuxembourgerMacedonianMalaysianMalteseMarshalleseMenomineeMexicanMexican American IndianMongolianMoroccanNative HawaiianNavajoNepaleseNew ZealanderNicaraguanNigerianNorthern EuropeanNorwegianOkinawanOsageOttawaPaiutePakistaniPalestinianPanamanianParaguayanPennsylvania GermanPeruvianPimaPolishPortuguesePotawatomiPuebloPuerto RicanPuget Sound SalishRomanianRussianSalvadoranSamoanScandinavianScotch-IrishScottishSeminoleSenegaleseSerbianShoshoneSierra LeoneanSiouxSlavicSlovakSloveneSomaliSouth AfricanSouth AmericanSouth American IndianSoviet UnionSpaniardSpanishSpanish AmericanSpanish American IndianSri LankanSubsaharan AfricanSudaneseSwedishSwissSyrianTaiwaneseThaiTlingit-HaidaTohono O'OdhamTonganTrinidadian and TobagonianTsimshianTurkishU.S. Virgin IslanderUgandanUkrainianUruguayanUteVenezuelanVietnameseWelshWest IndianYakamaYaquiYugoslavianYumanYup'ikZimbabwean
Immigration
NonimmigrantsImmigrantsAfghanistanAfricaAlbaniaArgentinaArmeniaAsiaAustraliaAustriaBahamasBangladeshBarbadosBelarusBelgiumBelizeBoliviaBosnia and HerzegovinaBrazilBulgariaBurma/MyanmarCabo VerdeCambodiaCameroonCanadaCaribbeanCentral AmericaChileChinaColombiaCongoCosta RicaCroatiaCubaCzechoslovakiaDenmarkDominicaDominican RepublicEastern AfricaEastern AsiaEastern EuropeEcuadorEgyptEl SalvadorEnglandEritreaEthiopiaEuropeFijiFranceGermanyGhanaGreeceGrenadaGuatemalaGuyanaHaitiHondurasHong KongHungaryIndiaIndonesiaIranIraqIrelandIsraelItalyJamaicaJapanJordanKazakhstanKenyaKoreaKuwaitLaosLatin AmericaLatviaLebanonLiberiaLithuaniaMalaysiaMexicoMicronesiaMiddle AfricaMoldovaMoroccoNepalNetherlandsNicaraguaNigeriaNorth AmericaNorth MacedoniaNorthern AfricaNorthern EuropeNorwayOceaniaPakistanPanamaPeruPolandPortugalRomaniaRussiaSaudi ArabiaScotlandSenegalSerbiaSierra LeoneSingaporeSomaliaSouth AfricaSouth AmericaSouth Central AsiaSouth Eastern AsiaSouthern EuropeSpainSri LankaSt. Vincent and the GrenadinesSudanSwedenSwitzerlandSyriaTaiwanThailandTrinidad and TobagoTurkeyUgandaUkraineUruguayUzbekistanVenezuelaVietnamWest IndiesWestern AfricaWestern AsiaWestern EuropeYemenZaireZimbabweAzores
Disability Age 65 to 74
Income
Poverty
Unemployment
Labor Participation
Family Structure
Vehicle Availability
Education Level
Disability

Disability Age 65 to 74 Comparison

Immigrants from Philippines

Immigrants from Turkey

Good
Exceptional
23.2%
DISABILITY AGE 65 TO 74
61.1/ 100
METRIC RATING
163rd/ 347
METRIC RANK
21.4%
DISABILITY AGE 65 TO 74
99.7/ 100
METRIC RATING
46th/ 347
METRIC RANK

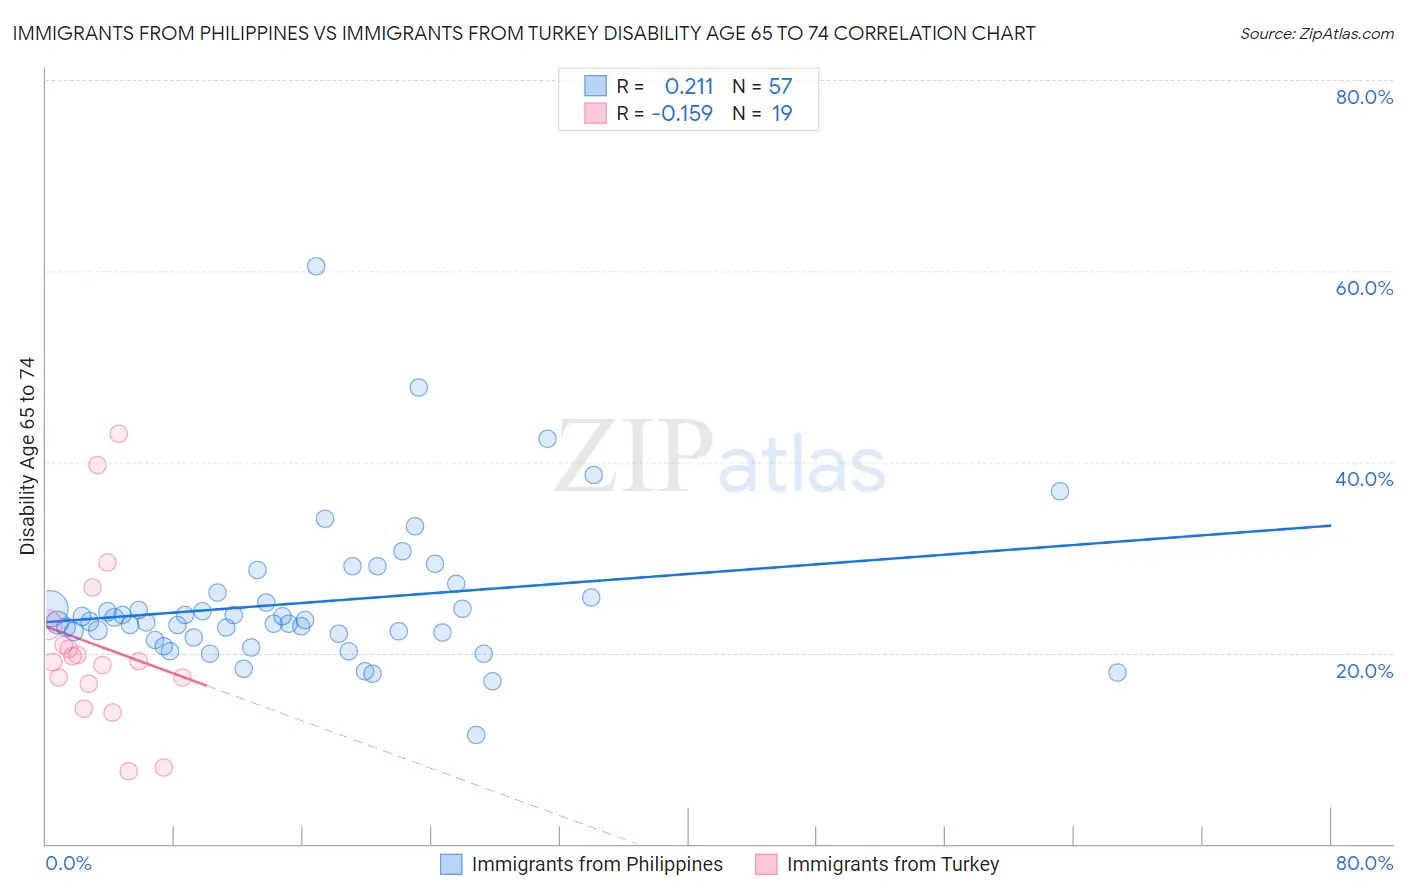
Immigrants from Philippines vs Immigrants from Turkey Disability Age 65 to 74 Correlation Chart

The statistical analysis conducted on geographies consisting of 470,156,643 people shows a weak positive correlation between the proportion of Immigrants from Philippines and percentage of population with a disability between the ages 65 and 75 in the United States with a correlation coefficient (R) of 0.211 and weighted average of 23.2%. Similarly, the statistical analysis conducted on geographies consisting of 222,810,745 people shows a poor negative correlation between the proportion of Immigrants from Turkey and percentage of population with a disability between the ages 65 and 75 in the United States with a correlation coefficient (R) of -0.159 and weighted average of 21.4%, a difference of 8.5%.
Immigrants from Philippines vs Immigrants from Turkey Disability Age 65 to 74

Disability Age 65 to 74 Correlation Summary

MeasurementImmigrants from PhilippinesImmigrants from Turkey
Minimum11.4%7.7%
Maximum60.5%43.0%
Range49.1%35.3%
Mean25.3%20.8%
Median23.3%19.1%
Interquartile 25% (IQ1)21.8%16.8%
Interquartile 75% (IQ3)26.1%22.9%
Interquartile Range (IQR)4.3%6.1%
Standard Deviation (Sample)7.7%9.0%
Standard Deviation (Population)7.7%8.7%

Similar Demographics by Disability Age 65 to 74

Demographics Similar to Immigrants from Philippines by Disability Age 65 to 74

In terms of disability age 65 to 74, the demographic groups most similar to Immigrants from Philippines are European (23.2%, a difference of 0.0%), Sierra Leonean (23.2%, a difference of 0.010%), Vietnamese (23.2%, a difference of 0.020%), Immigrants from Afghanistan (23.2%, a difference of 0.040%), and Immigrants from Cameroon (23.1%, a difference of 0.16%).
DemographicsRating | RankDisability Age 65 to 74
Immigrants | Western Asia
73.8
/100
|
#156
Good
23.0%
Czechoslovakians
72.4
/100
|
#157
Good
23.0%
Immigrants | Vietnam
69.1
/100
|
#158
Good
23.1%
South American Indians
65.5
/100
|
#159
Good
23.1%
Koreans
64.2
/100
|
#160
Good
23.1%
Immigrants | Cameroon
63.8
/100
|
#161
Good
23.1%
Europeans
61.2
/100
|
#162
Good
23.2%
Immigrants | Philippines
61.1
/100
|
#163
Good
23.2%
Sierra Leoneans
60.9
/100
|
#164
Good
23.2%
Vietnamese
60.8
/100
|
#165
Good
23.2%
Immigrants | Afghanistan
60.5
/100
|
#166
Good
23.2%
Immigrants | Bosnia and Herzegovina
57.6
/100
|
#167
Average
23.2%
Pakistanis
57.0
/100
|
#168
Average
23.2%
Icelanders
54.3
/100
|
#169
Average
23.3%
Moroccans
54.2
/100
|
#170
Average
23.3%

Demographics Similar to Immigrants from Turkey by Disability Age 65 to 74

In terms of disability age 65 to 74, the demographic groups most similar to Immigrants from Turkey are Immigrants from Bulgaria (21.4%, a difference of 0.0%), Asian (21.4%, a difference of 0.030%), Estonian (21.4%, a difference of 0.050%), Lithuanian (21.4%, a difference of 0.050%), and Luxembourger (21.4%, a difference of 0.050%).
DemographicsRating | RankDisability Age 65 to 74
Argentineans
99.8
/100
|
#39
Exceptional
21.2%
Latvians
99.8
/100
|
#40
Exceptional
21.2%
Immigrants | Austria
99.8
/100
|
#41
Exceptional
21.2%
Macedonians
99.7
/100
|
#42
Exceptional
21.3%
Immigrants | Croatia
99.7
/100
|
#43
Exceptional
21.3%
Estonians
99.7
/100
|
#44
Exceptional
21.4%
Asians
99.7
/100
|
#45
Exceptional
21.4%
Immigrants | Turkey
99.7
/100
|
#46
Exceptional
21.4%
Immigrants | Bulgaria
99.7
/100
|
#47
Exceptional
21.4%
Lithuanians
99.7
/100
|
#48
Exceptional
21.4%
Luxembourgers
99.7
/100
|
#49
Exceptional
21.4%
Immigrants | Malaysia
99.7
/100
|
#50
Exceptional
21.4%
Immigrants | Serbia
99.6
/100
|
#51
Exceptional
21.4%
Immigrants | France
99.6
/100
|
#52
Exceptional
21.5%
Bhutanese
99.6
/100
|
#53
Exceptional
21.5%