Immigrants from Panama vs Immigrants from Kazakhstan Disability Age Under 5
COMPARE
Immigrants from Panama
Immigrants from Kazakhstan
Disability Age Under 5
Disability Age Under 5 Comparison
Immigrants from Panama
Immigrants from Kazakhstan
1.2%
DISABILITY AGE UNDER 5
95.0/ 100
METRIC RATING
109th/ 347
METRIC RANK
1.1%
DISABILITY AGE UNDER 5
99.7/ 100
METRIC RATING
51st/ 347
METRIC RANK
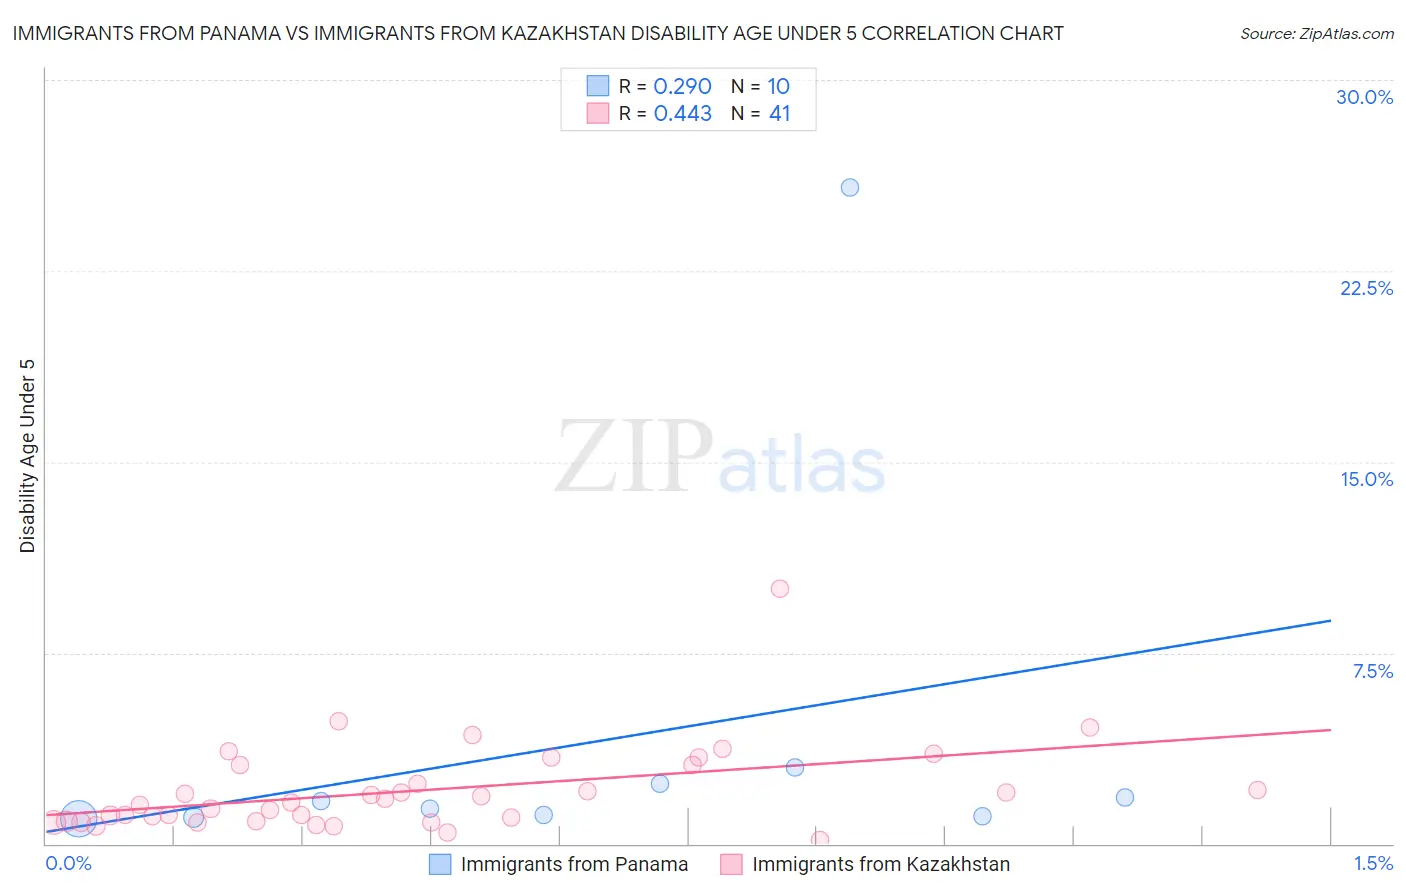
Immigrants from Panama vs Immigrants from Kazakhstan Disability Age Under 5 Correlation Chart
The statistical analysis conducted on geographies consisting of 142,970,984 people shows a weak positive correlation between the proportion of Immigrants from Panama and percentage of population with a disability under the age of 5 in the United States with a correlation coefficient (R) of 0.290 and weighted average of 1.2%. Similarly, the statistical analysis conducted on geographies consisting of 91,439,887 people shows a moderate positive correlation between the proportion of Immigrants from Kazakhstan and percentage of population with a disability under the age of 5 in the United States with a correlation coefficient (R) of 0.443 and weighted average of 1.1%, a difference of 7.4%.
Disability Age Under 5 Correlation Summary
| Measurement | Immigrants from Panama | Immigrants from Kazakhstan |
| Minimum | 1.0% | 0.14% |
| Maximum | 25.8% | 10.0% |
| Range | 24.8% | 9.9% |
| Mean | 4.0% | 2.1% |
| Median | 1.5% | 1.6% |
| Interquartile 25% (IQ1) | 1.1% | 0.89% |
| Interquartile 75% (IQ3) | 2.4% | 3.1% |
| Interquartile Range (IQR) | 1.3% | 2.2% |
| Standard Deviation (Sample) | 7.7% | 1.8% |
| Standard Deviation (Population) | 7.3% | 1.7% |
Similar Demographics by Disability Age Under 5
Demographics Similar to Immigrants from Panama by Disability Age Under 5
In terms of disability age under 5, the demographic groups most similar to Immigrants from Panama are Iraqi (1.2%, a difference of 0.020%), Immigrants from Lebanon (1.2%, a difference of 0.020%), Immigrants from West Indies (1.2%, a difference of 0.15%), Cambodian (1.2%, a difference of 0.19%), and Senegalese (1.2%, a difference of 0.22%).
| Demographics | Rating | Rank | Disability Age Under 5 |
| Immigrants | Morocco | 96.0 /100 | #102 | Exceptional 1.2% |
| Immigrants | Nicaragua | 96.0 /100 | #103 | Exceptional 1.2% |
| Indonesians | 95.9 /100 | #104 | Exceptional 1.2% |
| Immigrants | South Africa | 95.6 /100 | #105 | Exceptional 1.2% |
| Cambodians | 95.4 /100 | #106 | Exceptional 1.2% |
| Immigrants | West Indies | 95.3 /100 | #107 | Exceptional 1.2% |
| Iraqis | 95.1 /100 | #108 | Exceptional 1.2% |
| Immigrants | Panama | 95.0 /100 | #109 | Exceptional 1.2% |
| Immigrants | Lebanon | 95.0 /100 | #110 | Exceptional 1.2% |
| Senegalese | 94.6 /100 | #111 | Exceptional 1.2% |
| Immigrants | Australia | 94.4 /100 | #112 | Exceptional 1.2% |
| Immigrants | Oceania | 94.2 /100 | #113 | Exceptional 1.2% |
| Belizeans | 93.9 /100 | #114 | Exceptional 1.2% |
| Immigrants | Caribbean | 93.8 /100 | #115 | Exceptional 1.2% |
| Immigrants | Northern Africa | 93.8 /100 | #116 | Exceptional 1.2% |
Demographics Similar to Immigrants from Kazakhstan by Disability Age Under 5
In terms of disability age under 5, the demographic groups most similar to Immigrants from Kazakhstan are Immigrants from Japan (1.1%, a difference of 0.19%), Immigrants from Russia (1.1%, a difference of 0.20%), Immigrants from Singapore (1.1%, a difference of 0.41%), Immigrants from Bolivia (1.1%, a difference of 0.42%), and Immigrants from Sweden (1.1%, a difference of 0.63%).
| Demographics | Rating | Rank | Disability Age Under 5 |
| Immigrants | Asia | 99.8 /100 | #44 | Exceptional 1.1% |
| Immigrants | Turkey | 99.8 /100 | #45 | Exceptional 1.1% |
| Immigrants | Congo | 99.8 /100 | #46 | Exceptional 1.1% |
| Immigrants | Sweden | 99.8 /100 | #47 | Exceptional 1.1% |
| Immigrants | Singapore | 99.7 /100 | #48 | Exceptional 1.1% |
| Immigrants | Russia | 99.7 /100 | #49 | Exceptional 1.1% |
| Immigrants | Japan | 99.7 /100 | #50 | Exceptional 1.1% |
| Immigrants | Kazakhstan | 99.7 /100 | #51 | Exceptional 1.1% |
| Immigrants | Bolivia | 99.6 /100 | #52 | Exceptional 1.1% |
| Asians | 99.6 /100 | #53 | Exceptional 1.1% |
| Immigrants | El Salvador | 99.6 /100 | #54 | Exceptional 1.1% |
| Salvadorans | 99.5 /100 | #55 | Exceptional 1.1% |
| Ecuadorians | 99.5 /100 | #56 | Exceptional 1.1% |
| Assyrians/Chaldeans/Syriacs | 99.5 /100 | #57 | Exceptional 1.1% |
| Immigrants | Egypt | 99.4 /100 | #58 | Exceptional 1.1% |