Immigrants from Panama vs Immigrants from Kazakhstan In Labor Force | Age 16-19
COMPARE
Immigrants from Panama
Immigrants from Kazakhstan
In Labor Force | Age 16-19
In Labor Force | Age 16-19 Comparison
Immigrants from Panama
Immigrants from Kazakhstan
34.0%
IN LABOR FORCE | AGE 16-19
0.4/ 100
METRIC RATING
273rd/ 347
METRIC RANK
35.2%
IN LABOR FORCE | AGE 16-19
4.5/ 100
METRIC RATING
232nd/ 347
METRIC RANK
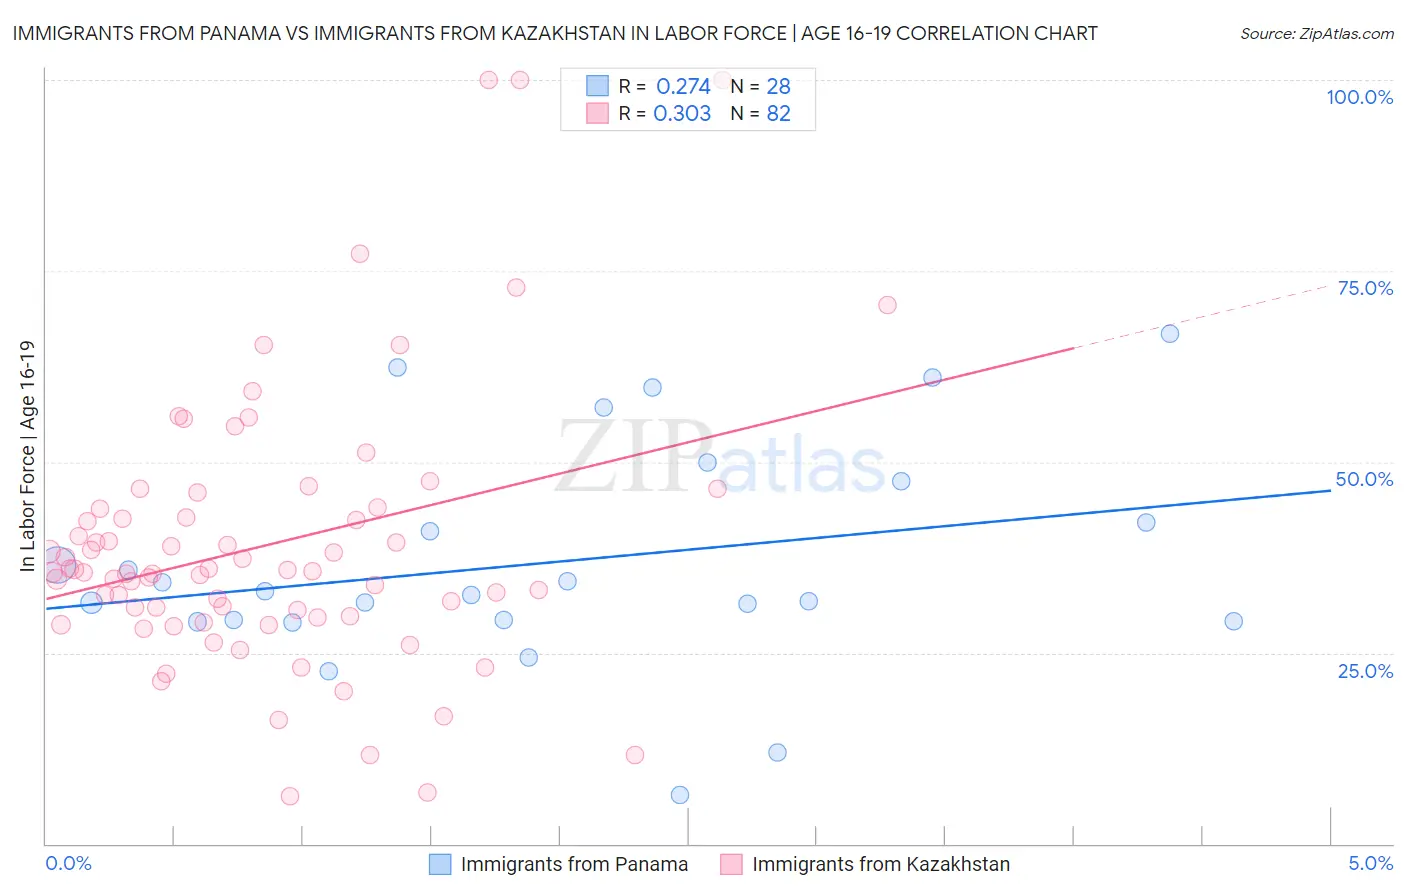
Immigrants from Panama vs Immigrants from Kazakhstan In Labor Force | Age 16-19 Correlation Chart
The statistical analysis conducted on geographies consisting of 221,074,600 people shows a weak positive correlation between the proportion of Immigrants from Panama and labor force participation rate among population between the ages 16 and 19 in the United States with a correlation coefficient (R) of 0.274 and weighted average of 34.0%. Similarly, the statistical analysis conducted on geographies consisting of 124,390,900 people shows a mild positive correlation between the proportion of Immigrants from Kazakhstan and labor force participation rate among population between the ages 16 and 19 in the United States with a correlation coefficient (R) of 0.303 and weighted average of 35.2%, a difference of 3.4%.
In Labor Force | Age 16-19 Correlation Summary
| Measurement | Immigrants from Panama | Immigrants from Kazakhstan |
| Minimum | 6.4% | 6.2% |
| Maximum | 66.7% | 100.0% |
| Range | 60.3% | 93.8% |
| Mean | 36.8% | 39.1% |
| Median | 32.8% | 35.6% |
| Interquartile 25% (IQ1) | 29.2% | 29.8% |
| Interquartile 75% (IQ3) | 44.8% | 43.9% |
| Interquartile Range (IQR) | 15.6% | 14.1% |
| Standard Deviation (Sample) | 14.6% | 18.0% |
| Standard Deviation (Population) | 14.3% | 17.9% |
Similar Demographics by In Labor Force | Age 16-19
Demographics Similar to Immigrants from Panama by In Labor Force | Age 16-19
In terms of in labor force | age 16-19, the demographic groups most similar to Immigrants from Panama are Venezuelan (34.0%, a difference of 0.090%), Immigrants from Fiji (33.9%, a difference of 0.18%), Asian (34.1%, a difference of 0.22%), Immigrants from Russia (34.1%, a difference of 0.24%), and Central American Indian (34.1%, a difference of 0.24%).
| Demographics | Rating | Rank | In Labor Force | Age 16-19 |
| Immigrants | Malaysia | 0.7 /100 | #266 | Tragic 34.3% |
| Immigrants | Peru | 0.5 /100 | #267 | Tragic 34.2% |
| Immigrants | Asia | 0.5 /100 | #268 | Tragic 34.1% |
| Pima | 0.5 /100 | #269 | Tragic 34.1% |
| Immigrants | Russia | 0.4 /100 | #270 | Tragic 34.1% |
| Central American Indians | 0.4 /100 | #271 | Tragic 34.1% |
| Asians | 0.4 /100 | #272 | Tragic 34.1% |
| Immigrants | Panama | 0.4 /100 | #273 | Tragic 34.0% |
| Venezuelans | 0.3 /100 | #274 | Tragic 34.0% |
| Immigrants | Fiji | 0.3 /100 | #275 | Tragic 33.9% |
| Immigrants | Latin America | 0.3 /100 | #276 | Tragic 33.9% |
| Menominee | 0.3 /100 | #277 | Tragic 33.9% |
| Colombians | 0.3 /100 | #278 | Tragic 33.8% |
| Paraguayans | 0.3 /100 | #279 | Tragic 33.8% |
| Taiwanese | 0.3 /100 | #280 | Tragic 33.8% |
Demographics Similar to Immigrants from Kazakhstan by In Labor Force | Age 16-19
In terms of in labor force | age 16-19, the demographic groups most similar to Immigrants from Kazakhstan are Immigrants from Syria (35.2%, a difference of 0.0%), Immigrants from France (35.1%, a difference of 0.040%), Immigrants from Mexico (35.1%, a difference of 0.080%), Immigrants from Honduras (35.2%, a difference of 0.12%), and Immigrants from Lebanon (35.2%, a difference of 0.16%).
| Demographics | Rating | Rank | In Labor Force | Age 16-19 |
| Immigrants | Belgium | 6.1 /100 | #225 | Tragic 35.3% |
| Immigrants | Guatemala | 5.7 /100 | #226 | Tragic 35.3% |
| Mongolians | 5.7 /100 | #227 | Tragic 35.3% |
| Immigrants | Senegal | 5.5 /100 | #228 | Tragic 35.3% |
| Immigrants | Lebanon | 5.0 /100 | #229 | Tragic 35.2% |
| Immigrants | Honduras | 4.9 /100 | #230 | Tragic 35.2% |
| Immigrants | Syria | 4.5 /100 | #231 | Tragic 35.2% |
| Immigrants | Kazakhstan | 4.5 /100 | #232 | Tragic 35.2% |
| Immigrants | France | 4.3 /100 | #233 | Tragic 35.1% |
| Immigrants | Mexico | 4.2 /100 | #234 | Tragic 35.1% |
| Immigrants | Philippines | 4.0 /100 | #235 | Tragic 35.1% |
| Immigrants | Australia | 3.6 /100 | #236 | Tragic 35.1% |
| Immigrants | India | 3.5 /100 | #237 | Tragic 35.0% |
| Immigrants | Vietnam | 3.4 /100 | #238 | Tragic 35.0% |
| Inupiat | 3.2 /100 | #239 | Tragic 35.0% |