Mongolian vs Immigrants from Kazakhstan Disability Age Under 5
COMPARE
Mongolian
Immigrants from Kazakhstan
Disability Age Under 5
Disability Age Under 5 Comparison
Mongolians
Immigrants from Kazakhstan
1.1%
DISABILITY AGE UNDER 5
96.6/ 100
METRIC RATING
96th/ 347
METRIC RANK
1.1%
DISABILITY AGE UNDER 5
99.7/ 100
METRIC RATING
51st/ 347
METRIC RANK
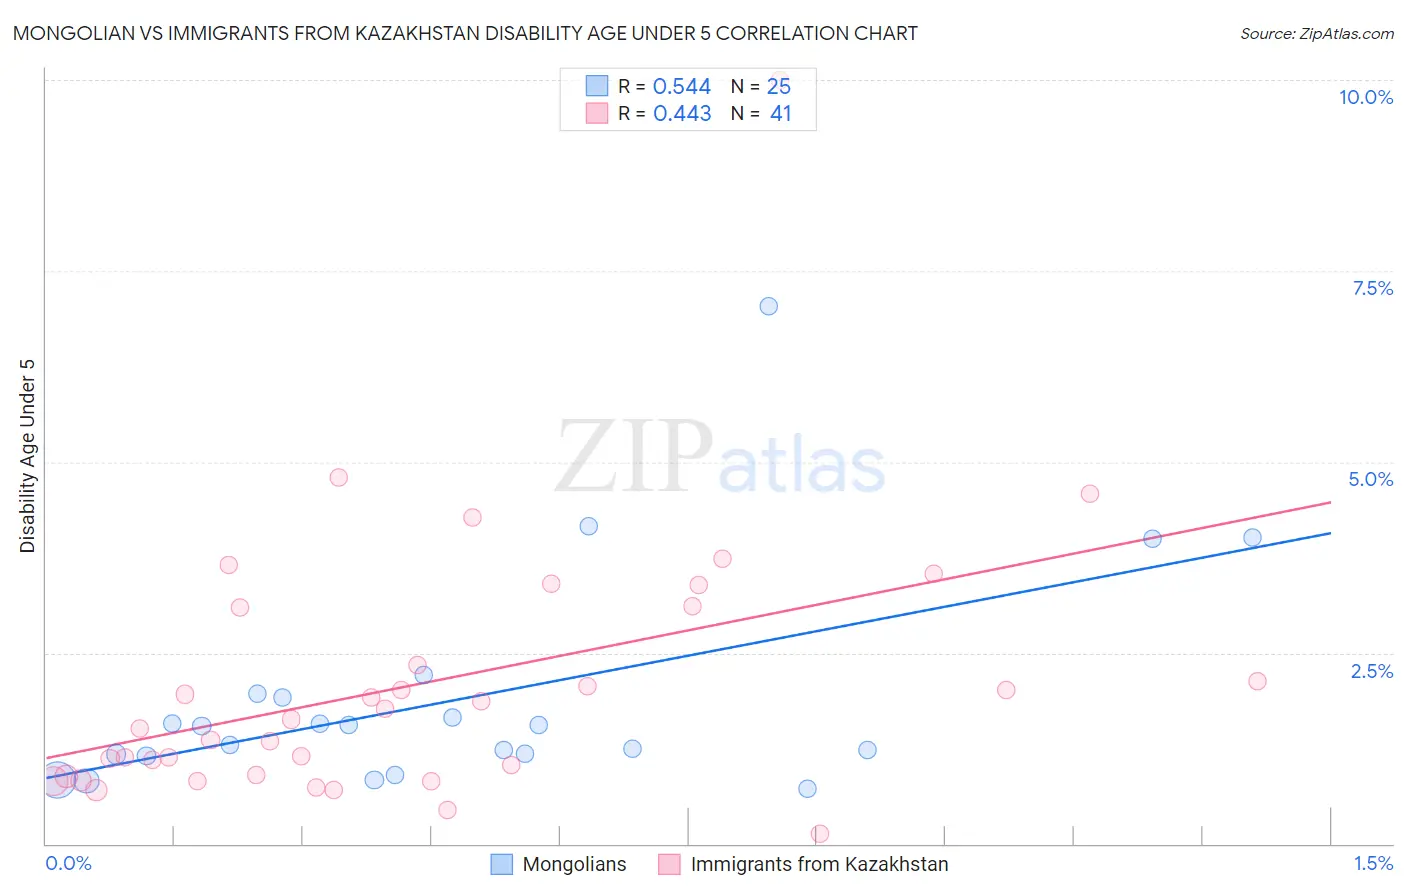
Mongolian vs Immigrants from Kazakhstan Disability Age Under 5 Correlation Chart
The statistical analysis conducted on geographies consisting of 103,209,852 people shows a substantial positive correlation between the proportion of Mongolians and percentage of population with a disability under the age of 5 in the United States with a correlation coefficient (R) of 0.544 and weighted average of 1.1%. Similarly, the statistical analysis conducted on geographies consisting of 91,439,887 people shows a moderate positive correlation between the proportion of Immigrants from Kazakhstan and percentage of population with a disability under the age of 5 in the United States with a correlation coefficient (R) of 0.443 and weighted average of 1.1%, a difference of 6.4%.
Disability Age Under 5 Correlation Summary
| Measurement | Mongolian | Immigrants from Kazakhstan |
| Minimum | 0.73% | 0.14% |
| Maximum | 7.0% | 10.0% |
| Range | 6.3% | 9.9% |
| Mean | 1.9% | 2.1% |
| Median | 1.5% | 1.6% |
| Interquartile 25% (IQ1) | 1.2% | 0.89% |
| Interquartile 75% (IQ3) | 1.9% | 3.1% |
| Interquartile Range (IQR) | 0.78% | 2.2% |
| Standard Deviation (Sample) | 1.4% | 1.8% |
| Standard Deviation (Population) | 1.4% | 1.7% |
Similar Demographics by Disability Age Under 5
Demographics Similar to Mongolians by Disability Age Under 5
In terms of disability age under 5, the demographic groups most similar to Mongolians are Immigrants from Moldova (1.1%, a difference of 0.10%), Immigrants from Iraq (1.1%, a difference of 0.10%), Immigrants from South Eastern Asia (1.1%, a difference of 0.11%), Sri Lankan (1.1%, a difference of 0.16%), and Spanish American (1.1%, a difference of 0.22%).
| Demographics | Rating | Rank | Disability Age Under 5 |
| Ethiopians | 97.2 /100 | #89 | Exceptional 1.1% |
| Chinese | 97.2 /100 | #90 | Exceptional 1.1% |
| Albanians | 97.2 /100 | #91 | Exceptional 1.1% |
| Immigrants | Cuba | 97.0 /100 | #92 | Exceptional 1.1% |
| Spanish Americans | 96.9 /100 | #93 | Exceptional 1.1% |
| Sri Lankans | 96.8 /100 | #94 | Exceptional 1.1% |
| Immigrants | Moldova | 96.8 /100 | #95 | Exceptional 1.1% |
| Mongolians | 96.6 /100 | #96 | Exceptional 1.1% |
| Immigrants | Iraq | 96.5 /100 | #97 | Exceptional 1.1% |
| Immigrants | South Eastern Asia | 96.5 /100 | #98 | Exceptional 1.1% |
| Dominicans | 96.3 /100 | #99 | Exceptional 1.1% |
| Nicaraguans | 96.3 /100 | #100 | Exceptional 1.1% |
| Immigrants | Uganda | 96.1 /100 | #101 | Exceptional 1.1% |
| Immigrants | Morocco | 96.0 /100 | #102 | Exceptional 1.2% |
| Immigrants | Nicaragua | 96.0 /100 | #103 | Exceptional 1.2% |
Demographics Similar to Immigrants from Kazakhstan by Disability Age Under 5
In terms of disability age under 5, the demographic groups most similar to Immigrants from Kazakhstan are Immigrants from Japan (1.1%, a difference of 0.19%), Immigrants from Russia (1.1%, a difference of 0.20%), Immigrants from Singapore (1.1%, a difference of 0.41%), Immigrants from Bolivia (1.1%, a difference of 0.42%), and Immigrants from Sweden (1.1%, a difference of 0.63%).
| Demographics | Rating | Rank | Disability Age Under 5 |
| Immigrants | Asia | 99.8 /100 | #44 | Exceptional 1.1% |
| Immigrants | Turkey | 99.8 /100 | #45 | Exceptional 1.1% |
| Immigrants | Congo | 99.8 /100 | #46 | Exceptional 1.1% |
| Immigrants | Sweden | 99.8 /100 | #47 | Exceptional 1.1% |
| Immigrants | Singapore | 99.7 /100 | #48 | Exceptional 1.1% |
| Immigrants | Russia | 99.7 /100 | #49 | Exceptional 1.1% |
| Immigrants | Japan | 99.7 /100 | #50 | Exceptional 1.1% |
| Immigrants | Kazakhstan | 99.7 /100 | #51 | Exceptional 1.1% |
| Immigrants | Bolivia | 99.6 /100 | #52 | Exceptional 1.1% |
| Asians | 99.6 /100 | #53 | Exceptional 1.1% |
| Immigrants | El Salvador | 99.6 /100 | #54 | Exceptional 1.1% |
| Salvadorans | 99.5 /100 | #55 | Exceptional 1.1% |
| Ecuadorians | 99.5 /100 | #56 | Exceptional 1.1% |
| Assyrians/Chaldeans/Syriacs | 99.5 /100 | #57 | Exceptional 1.1% |
| Immigrants | Egypt | 99.4 /100 | #58 | Exceptional 1.1% |