Immigrants from Pakistan vs Mexican American Indian Cognitive Disability
COMPARE
Immigrants from Pakistan
Mexican American Indian
Cognitive Disability
Cognitive Disability Comparison
Immigrants from Pakistan
Mexican American Indians
16.4%
COGNITIVE DISABILITY
99.9/ 100
METRIC RATING
27th/ 347
METRIC RANK
17.9%
COGNITIVE DISABILITY
0.6/ 100
METRIC RATING
257th/ 347
METRIC RANK
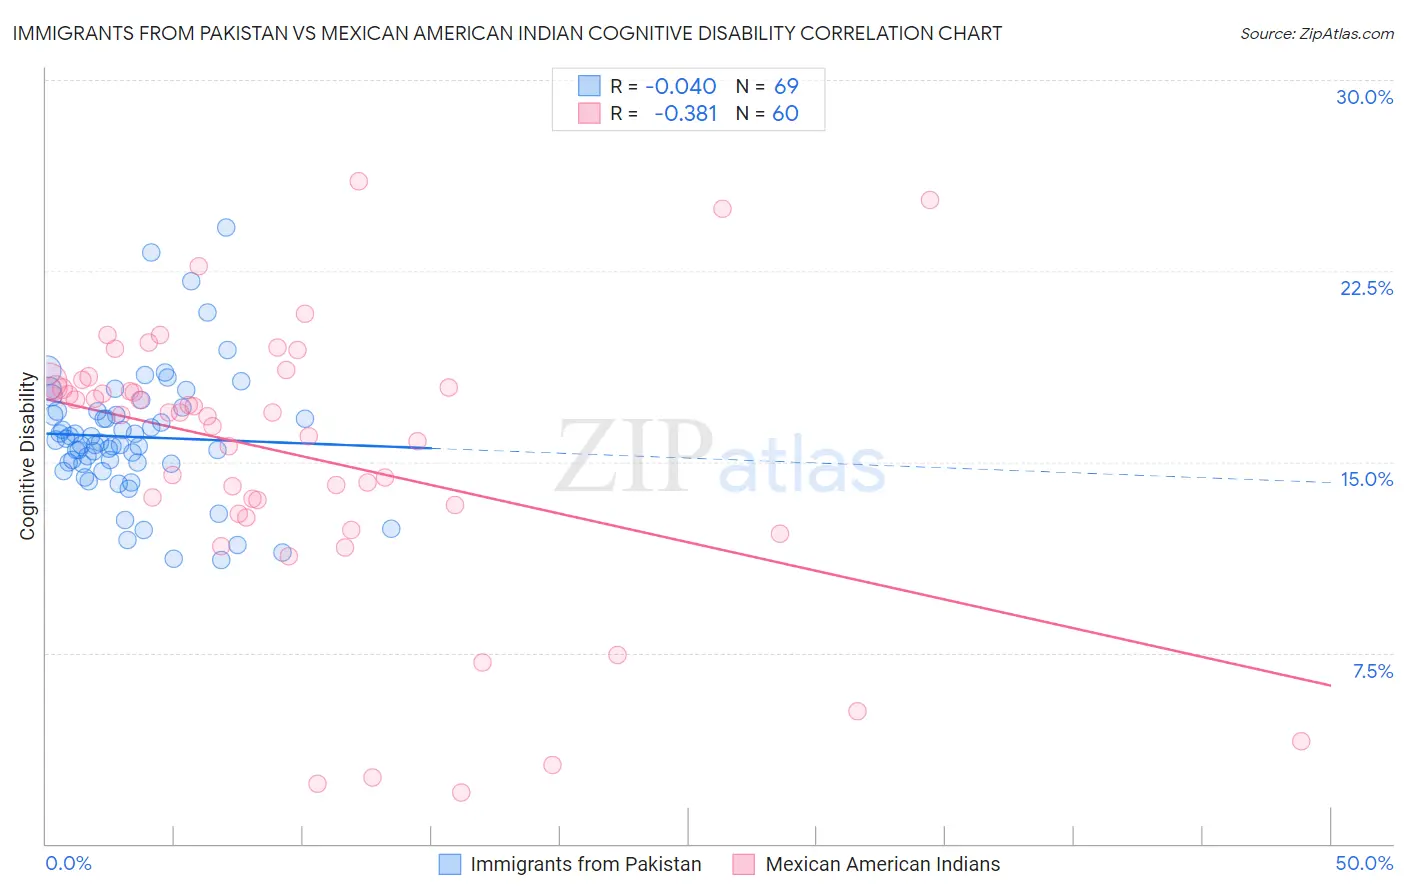
Immigrants from Pakistan vs Mexican American Indian Cognitive Disability Correlation Chart
The statistical analysis conducted on geographies consisting of 283,893,099 people shows no correlation between the proportion of Immigrants from Pakistan and percentage of population with cognitive disability in the United States with a correlation coefficient (R) of -0.040 and weighted average of 16.4%. Similarly, the statistical analysis conducted on geographies consisting of 317,571,331 people shows a mild negative correlation between the proportion of Mexican American Indians and percentage of population with cognitive disability in the United States with a correlation coefficient (R) of -0.381 and weighted average of 17.9%, a difference of 9.3%.
Cognitive Disability Correlation Summary
| Measurement | Immigrants from Pakistan | Mexican American Indian |
| Minimum | 11.1% | 2.0% |
| Maximum | 24.2% | 26.0% |
| Range | 13.1% | 24.0% |
| Mean | 16.0% | 15.2% |
| Median | 15.8% | 16.9% |
| Interquartile 25% (IQ1) | 14.9% | 13.1% |
| Interquartile 75% (IQ3) | 17.0% | 18.0% |
| Interquartile Range (IQR) | 2.1% | 4.9% |
| Standard Deviation (Sample) | 2.5% | 5.4% |
| Standard Deviation (Population) | 2.5% | 5.4% |
Similar Demographics by Cognitive Disability
Demographics Similar to Immigrants from Pakistan by Cognitive Disability
In terms of cognitive disability, the demographic groups most similar to Immigrants from Pakistan are Polish (16.4%, a difference of 0.0%), Immigrants from Croatia (16.4%, a difference of 0.020%), Filipino (16.4%, a difference of 0.030%), Czech (16.4%, a difference of 0.030%), and Luxembourger (16.4%, a difference of 0.050%).
| Demographics | Rating | Rank | Cognitive Disability |
| Bulgarians | 100.0 /100 | #20 | Exceptional 16.3% |
| Immigrants | Cuba | 100.0 /100 | #21 | Exceptional 16.3% |
| Immigrants | South Central Asia | 99.9 /100 | #22 | Exceptional 16.4% |
| Croatians | 99.9 /100 | #23 | Exceptional 16.4% |
| Immigrants | Argentina | 99.9 /100 | #24 | Exceptional 16.4% |
| Luxembourgers | 99.9 /100 | #25 | Exceptional 16.4% |
| Immigrants | Croatia | 99.9 /100 | #26 | Exceptional 16.4% |
| Immigrants | Pakistan | 99.9 /100 | #27 | Exceptional 16.4% |
| Poles | 99.9 /100 | #28 | Exceptional 16.4% |
| Filipinos | 99.9 /100 | #29 | Exceptional 16.4% |
| Czechs | 99.9 /100 | #30 | Exceptional 16.4% |
| Immigrants | Romania | 99.9 /100 | #31 | Exceptional 16.4% |
| Immigrants | Israel | 99.9 /100 | #32 | Exceptional 16.4% |
| Italians | 99.9 /100 | #33 | Exceptional 16.4% |
| Russians | 99.9 /100 | #34 | Exceptional 16.4% |
Demographics Similar to Mexican American Indians by Cognitive Disability
In terms of cognitive disability, the demographic groups most similar to Mexican American Indians are Immigrants from Armenia (17.9%, a difference of 0.010%), Bahamian (17.9%, a difference of 0.040%), Hopi (17.9%, a difference of 0.050%), Hispanic or Latino (17.9%, a difference of 0.050%), and Immigrants from the Azores (17.9%, a difference of 0.050%).
| Demographics | Rating | Rank | Cognitive Disability |
| Immigrants | Ethiopia | 0.7 /100 | #250 | Tragic 17.9% |
| Malaysians | 0.6 /100 | #251 | Tragic 17.9% |
| Immigrants | Grenada | 0.6 /100 | #252 | Tragic 17.9% |
| Hopi | 0.6 /100 | #253 | Tragic 17.9% |
| Hispanics or Latinos | 0.6 /100 | #254 | Tragic 17.9% |
| Immigrants | Azores | 0.6 /100 | #255 | Tragic 17.9% |
| Bahamians | 0.6 /100 | #256 | Tragic 17.9% |
| Mexican American Indians | 0.6 /100 | #257 | Tragic 17.9% |
| Immigrants | Armenia | 0.6 /100 | #258 | Tragic 17.9% |
| Ethiopians | 0.5 /100 | #259 | Tragic 17.9% |
| Immigrants | Belize | 0.5 /100 | #260 | Tragic 17.9% |
| Guamanians/Chamorros | 0.5 /100 | #261 | Tragic 17.9% |
| Sierra Leoneans | 0.4 /100 | #262 | Tragic 17.9% |
| Immigrants | Barbados | 0.4 /100 | #263 | Tragic 17.9% |
| Menominee | 0.4 /100 | #264 | Tragic 18.0% |