Immigrants from Oceania vs Mongolian Hearing Disability
COMPARE
Immigrants from Oceania
Mongolian
Hearing Disability
Hearing Disability Comparison
Immigrants from Oceania
Mongolians
3.2%
HEARING DISABILITY
6.5/ 100
METRIC RATING
222nd/ 347
METRIC RANK
2.7%
HEARING DISABILITY
97.4/ 100
METRIC RATING
78th/ 347
METRIC RANK
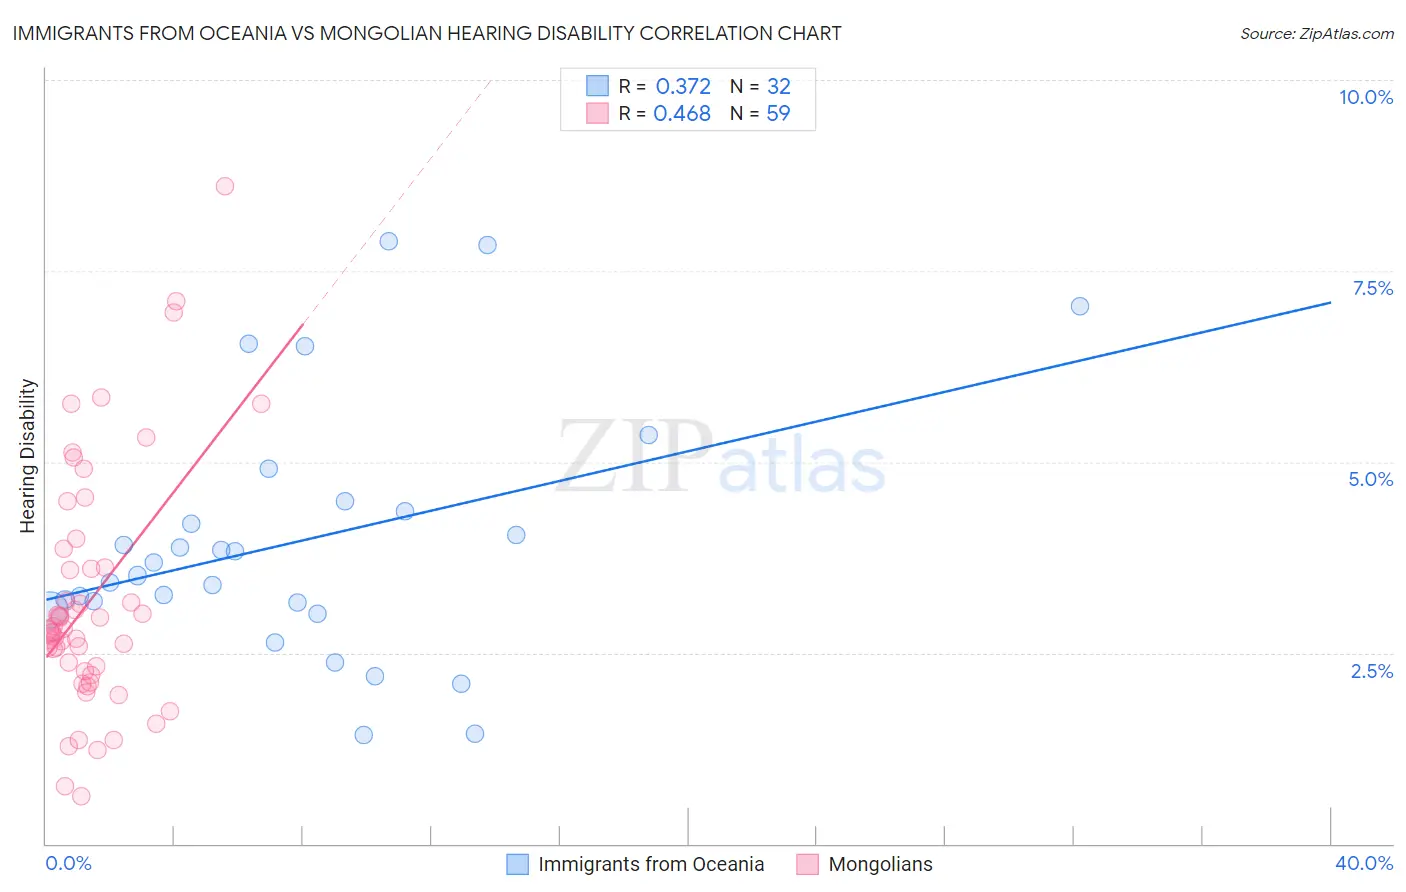
Immigrants from Oceania vs Mongolian Hearing Disability Correlation Chart
The statistical analysis conducted on geographies consisting of 305,402,457 people shows a mild positive correlation between the proportion of Immigrants from Oceania and percentage of population with hearing disability in the United States with a correlation coefficient (R) of 0.372 and weighted average of 3.2%. Similarly, the statistical analysis conducted on geographies consisting of 140,352,505 people shows a moderate positive correlation between the proportion of Mongolians and percentage of population with hearing disability in the United States with a correlation coefficient (R) of 0.468 and weighted average of 2.7%, a difference of 16.2%.
Hearing Disability Correlation Summary
| Measurement | Immigrants from Oceania | Mongolian |
| Minimum | 1.4% | 0.63% |
| Maximum | 7.9% | 8.6% |
| Range | 6.5% | 8.0% |
| Mean | 4.0% | 3.2% |
| Median | 3.6% | 2.8% |
| Interquartile 25% (IQ1) | 3.1% | 2.3% |
| Interquartile 75% (IQ3) | 4.4% | 3.6% |
| Interquartile Range (IQR) | 1.3% | 1.4% |
| Standard Deviation (Sample) | 1.7% | 1.6% |
| Standard Deviation (Population) | 1.6% | 1.6% |
Similar Demographics by Hearing Disability
Demographics Similar to Immigrants from Oceania by Hearing Disability
In terms of hearing disability, the demographic groups most similar to Immigrants from Oceania are Malaysian (3.2%, a difference of 0.040%), Immigrants from Laos (3.2%, a difference of 0.040%), New Zealander (3.2%, a difference of 0.10%), Immigrants from Northern Europe (3.2%, a difference of 0.16%), and Russian (3.2%, a difference of 0.20%).
| Demographics | Rating | Rank | Hearing Disability |
| Bangladeshis | 8.1 /100 | #215 | Tragic 3.2% |
| Immigrants | Norway | 7.3 /100 | #216 | Tragic 3.2% |
| Russians | 7.1 /100 | #217 | Tragic 3.2% |
| Immigrants | Northern Europe | 7.0 /100 | #218 | Tragic 3.2% |
| New Zealanders | 6.8 /100 | #219 | Tragic 3.2% |
| Malaysians | 6.6 /100 | #220 | Tragic 3.2% |
| Immigrants | Laos | 6.6 /100 | #221 | Tragic 3.2% |
| Immigrants | Oceania | 6.5 /100 | #222 | Tragic 3.2% |
| Mexicans | 5.6 /100 | #223 | Tragic 3.2% |
| Icelanders | 5.2 /100 | #224 | Tragic 3.2% |
| Latvians | 5.1 /100 | #225 | Tragic 3.2% |
| Lebanese | 5.0 /100 | #226 | Tragic 3.2% |
| Bhutanese | 4.6 /100 | #227 | Tragic 3.2% |
| Immigrants | Portugal | 4.3 /100 | #228 | Tragic 3.2% |
| Maltese | 4.1 /100 | #229 | Tragic 3.2% |
Demographics Similar to Mongolians by Hearing Disability
In terms of hearing disability, the demographic groups most similar to Mongolians are Colombian (2.7%, a difference of 0.020%), Immigrants from Malaysia (2.7%, a difference of 0.040%), Immigrants from Saudi Arabia (2.7%, a difference of 0.070%), Asian (2.7%, a difference of 0.070%), and Immigrants from Korea (2.7%, a difference of 0.090%).
| Demographics | Rating | Rank | Hearing Disability |
| Central Americans | 97.7 /100 | #71 | Exceptional 2.7% |
| Afghans | 97.6 /100 | #72 | Exceptional 2.7% |
| Argentineans | 97.5 /100 | #73 | Exceptional 2.7% |
| Immigrants | Korea | 97.5 /100 | #74 | Exceptional 2.7% |
| Immigrants | Saudi Arabia | 97.5 /100 | #75 | Exceptional 2.7% |
| Asians | 97.5 /100 | #76 | Exceptional 2.7% |
| Immigrants | Malaysia | 97.5 /100 | #77 | Exceptional 2.7% |
| Mongolians | 97.4 /100 | #78 | Exceptional 2.7% |
| Colombians | 97.4 /100 | #79 | Exceptional 2.7% |
| Immigrants | Asia | 97.2 /100 | #80 | Exceptional 2.7% |
| Immigrants | Uruguay | 97.2 /100 | #81 | Exceptional 2.7% |
| Immigrants | Armenia | 97.2 /100 | #82 | Exceptional 2.7% |
| Immigrants | Cuba | 97.2 /100 | #83 | Exceptional 2.7% |
| Immigrants | Argentina | 97.0 /100 | #84 | Exceptional 2.8% |
| Immigrants | Northern Africa | 96.9 /100 | #85 | Exceptional 2.8% |