Immigrants from Norway vs Menominee Ambulatory Disability
COMPARE
Immigrants from Norway
Menominee
Ambulatory Disability
Ambulatory Disability Comparison
Immigrants from Norway
Menominee
5.9%
AMBULATORY DISABILITY
90.5/ 100
METRIC RATING
129th/ 347
METRIC RANK
7.8%
AMBULATORY DISABILITY
0.0/ 100
METRIC RATING
332nd/ 347
METRIC RANK
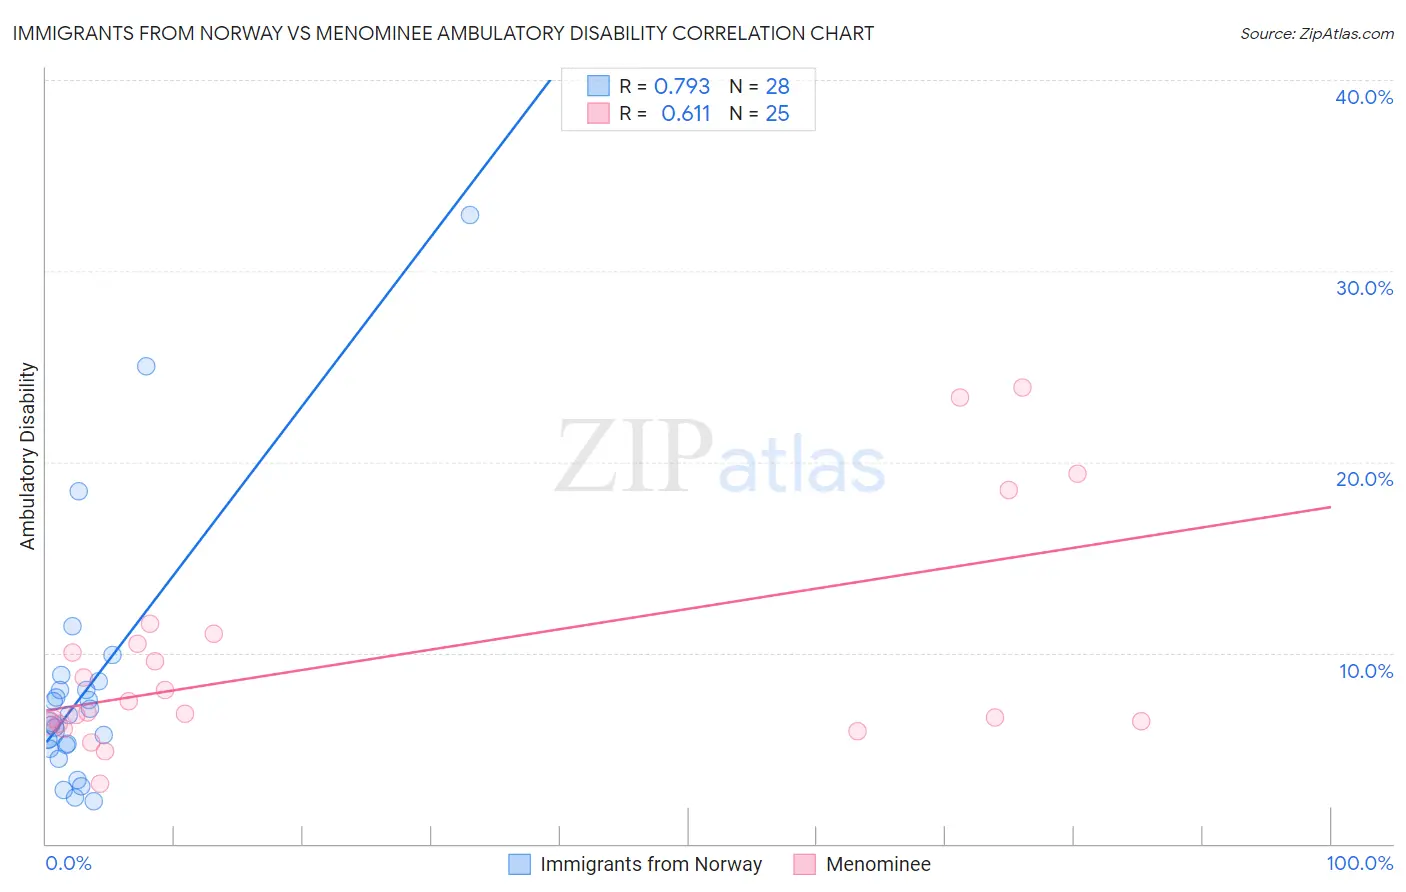
Immigrants from Norway vs Menominee Ambulatory Disability Correlation Chart
The statistical analysis conducted on geographies consisting of 116,699,496 people shows a strong positive correlation between the proportion of Immigrants from Norway and percentage of population with ambulatory disability in the United States with a correlation coefficient (R) of 0.793 and weighted average of 5.9%. Similarly, the statistical analysis conducted on geographies consisting of 45,777,730 people shows a significant positive correlation between the proportion of Menominee and percentage of population with ambulatory disability in the United States with a correlation coefficient (R) of 0.611 and weighted average of 7.8%, a difference of 31.5%.
Ambulatory Disability Correlation Summary
| Measurement | Immigrants from Norway | Menominee |
| Minimum | 2.3% | 3.2% |
| Maximum | 33.0% | 23.9% |
| Range | 30.7% | 20.8% |
| Mean | 8.2% | 9.6% |
| Median | 6.5% | 6.9% |
| Interquartile 25% (IQ1) | 5.1% | 6.3% |
| Interquartile 75% (IQ3) | 8.3% | 10.8% |
| Interquartile Range (IQR) | 3.2% | 4.4% |
| Standard Deviation (Sample) | 6.8% | 5.7% |
| Standard Deviation (Population) | 6.6% | 5.5% |
Similar Demographics by Ambulatory Disability
Demographics Similar to Immigrants from Norway by Ambulatory Disability
In terms of ambulatory disability, the demographic groups most similar to Immigrants from Norway are Immigrants from Western Asia (5.9%, a difference of 0.030%), Immigrants from Nigeria (5.9%, a difference of 0.070%), Immigrants from Kazakhstan (5.9%, a difference of 0.11%), Immigrants from Costa Rica (5.9%, a difference of 0.14%), and Arab (5.9%, a difference of 0.17%).
| Demographics | Rating | Rank | Ambulatory Disability |
| Icelanders | 92.6 /100 | #122 | Exceptional 5.9% |
| Immigrants | Russia | 92.4 /100 | #123 | Exceptional 5.9% |
| Immigrants | Middle Africa | 92.2 /100 | #124 | Exceptional 5.9% |
| Koreans | 91.6 /100 | #125 | Exceptional 5.9% |
| Arabs | 91.5 /100 | #126 | Exceptional 5.9% |
| Immigrants | Nigeria | 90.9 /100 | #127 | Exceptional 5.9% |
| Immigrants | Western Asia | 90.7 /100 | #128 | Exceptional 5.9% |
| Immigrants | Norway | 90.5 /100 | #129 | Exceptional 5.9% |
| Immigrants | Kazakhstan | 89.7 /100 | #130 | Excellent 5.9% |
| Immigrants | Costa Rica | 89.5 /100 | #131 | Excellent 5.9% |
| Immigrants | Europe | 87.8 /100 | #132 | Excellent 6.0% |
| Immigrants | Immigrants | 86.9 /100 | #133 | Excellent 6.0% |
| Ute | 86.6 /100 | #134 | Excellent 6.0% |
| Immigrants | Italy | 85.0 /100 | #135 | Excellent 6.0% |
| Immigrants | North Macedonia | 84.1 /100 | #136 | Excellent 6.0% |
Demographics Similar to Menominee by Ambulatory Disability
In terms of ambulatory disability, the demographic groups most similar to Menominee are Cajun (7.8%, a difference of 0.28%), Cherokee (7.9%, a difference of 0.89%), Paiute (7.7%, a difference of 1.5%), Yuman (7.9%, a difference of 1.8%), and Pueblo (7.6%, a difference of 2.7%).
| Demographics | Rating | Rank | Ambulatory Disability |
| Comanche | 0.0 /100 | #325 | Tragic 7.5% |
| Blacks/African Americans | 0.0 /100 | #326 | Tragic 7.5% |
| Natives/Alaskans | 0.0 /100 | #327 | Tragic 7.5% |
| Hopi | 0.0 /100 | #328 | Tragic 7.6% |
| Pueblo | 0.0 /100 | #329 | Tragic 7.6% |
| Paiute | 0.0 /100 | #330 | Tragic 7.7% |
| Cajuns | 0.0 /100 | #331 | Tragic 7.8% |
| Menominee | 0.0 /100 | #332 | Tragic 7.8% |
| Cherokee | 0.0 /100 | #333 | Tragic 7.9% |
| Yuman | 0.0 /100 | #334 | Tragic 7.9% |
| Chickasaw | 0.0 /100 | #335 | Tragic 8.0% |
| Seminole | 0.0 /100 | #336 | Tragic 8.0% |
| Dutch West Indians | 0.0 /100 | #337 | Tragic 8.2% |
| Colville | 0.0 /100 | #338 | Tragic 8.2% |
| Pima | 0.0 /100 | #339 | Tragic 8.2% |