Chilean vs Menominee Ambulatory Disability
COMPARE
Chilean
Menominee
Ambulatory Disability
Ambulatory Disability Comparison
Chileans
Menominee
5.7%
AMBULATORY DISABILITY
99.2/ 100
METRIC RATING
79th/ 347
METRIC RANK
7.8%
AMBULATORY DISABILITY
0.0/ 100
METRIC RATING
332nd/ 347
METRIC RANK
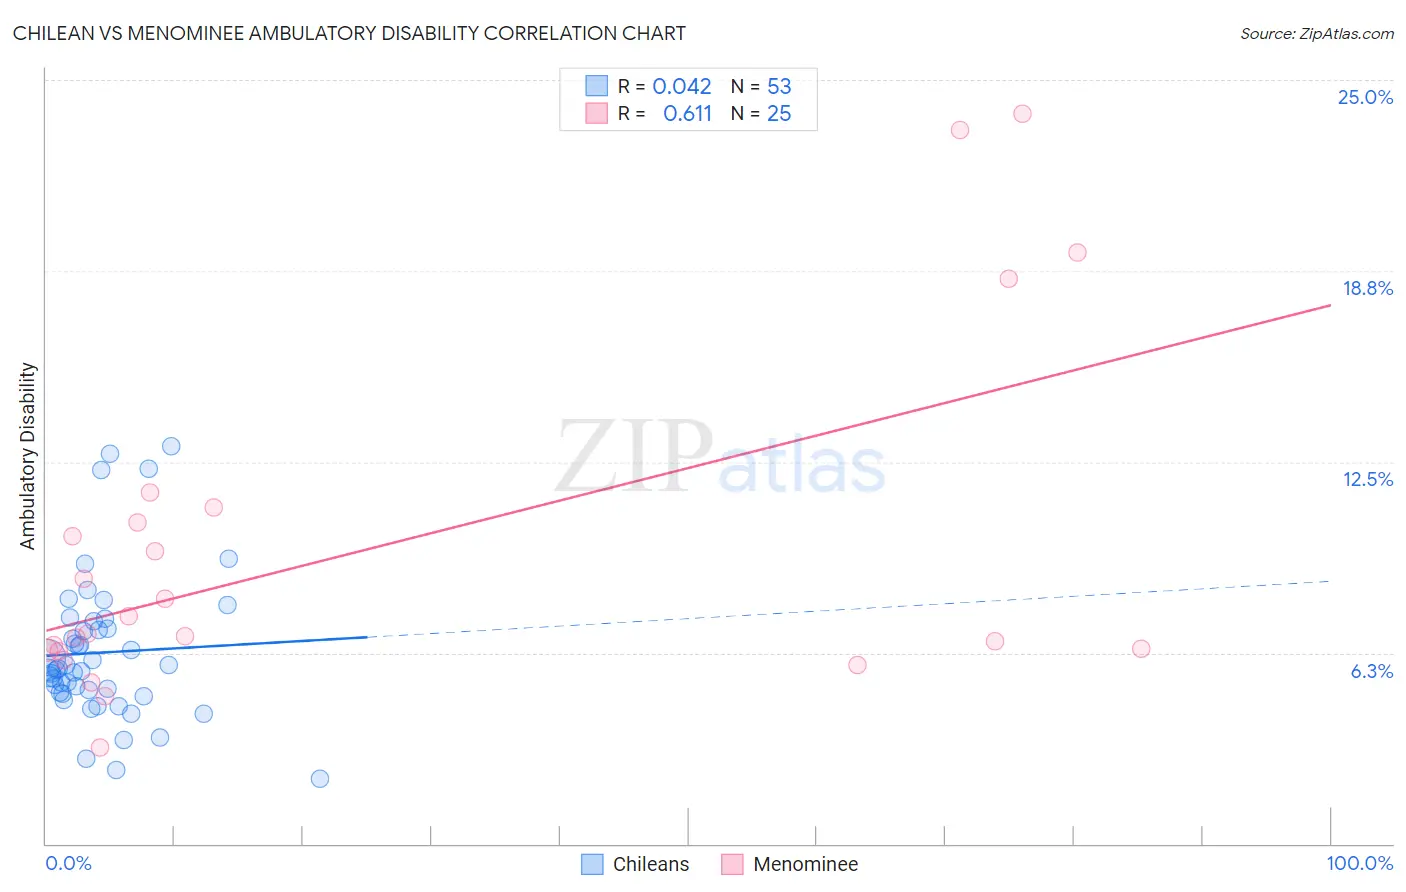
Chilean vs Menominee Ambulatory Disability Correlation Chart
The statistical analysis conducted on geographies consisting of 256,632,151 people shows no correlation between the proportion of Chileans and percentage of population with ambulatory disability in the United States with a correlation coefficient (R) of 0.042 and weighted average of 5.7%. Similarly, the statistical analysis conducted on geographies consisting of 45,777,730 people shows a significant positive correlation between the proportion of Menominee and percentage of population with ambulatory disability in the United States with a correlation coefficient (R) of 0.611 and weighted average of 7.8%, a difference of 36.4%.
Ambulatory Disability Correlation Summary
| Measurement | Chilean | Menominee |
| Minimum | 2.1% | 3.2% |
| Maximum | 13.0% | 23.9% |
| Range | 10.9% | 20.8% |
| Mean | 6.3% | 9.6% |
| Median | 5.7% | 6.9% |
| Interquartile 25% (IQ1) | 4.9% | 6.3% |
| Interquartile 75% (IQ3) | 7.2% | 10.8% |
| Interquartile Range (IQR) | 2.2% | 4.4% |
| Standard Deviation (Sample) | 2.4% | 5.7% |
| Standard Deviation (Population) | 2.3% | 5.5% |
Similar Demographics by Ambulatory Disability
Demographics Similar to Chileans by Ambulatory Disability
In terms of ambulatory disability, the demographic groups most similar to Chileans are Somali (5.7%, a difference of 0.010%), Immigrants from Vietnam (5.7%, a difference of 0.020%), Immigrants from Ireland (5.7%, a difference of 0.13%), Immigrants from Jordan (5.7%, a difference of 0.14%), and Palestinian (5.7%, a difference of 0.14%).
| Demographics | Rating | Rank | Ambulatory Disability |
| Brazilians | 99.4 /100 | #72 | Exceptional 5.7% |
| Immigrants | Northern Africa | 99.4 /100 | #73 | Exceptional 5.7% |
| Immigrants | Cameroon | 99.4 /100 | #74 | Exceptional 5.7% |
| Immigrants | South Africa | 99.3 /100 | #75 | Exceptional 5.7% |
| Sudanese | 99.3 /100 | #76 | Exceptional 5.7% |
| Immigrants | Vietnam | 99.3 /100 | #77 | Exceptional 5.7% |
| Somalis | 99.2 /100 | #78 | Exceptional 5.7% |
| Chileans | 99.2 /100 | #79 | Exceptional 5.7% |
| Immigrants | Ireland | 99.2 /100 | #80 | Exceptional 5.7% |
| Immigrants | Jordan | 99.2 /100 | #81 | Exceptional 5.7% |
| Palestinians | 99.2 /100 | #82 | Exceptional 5.7% |
| Eastern Europeans | 99.2 /100 | #83 | Exceptional 5.7% |
| Ugandans | 99.2 /100 | #84 | Exceptional 5.7% |
| South Americans | 99.0 /100 | #85 | Exceptional 5.7% |
| Latvians | 99.0 /100 | #86 | Exceptional 5.7% |
Demographics Similar to Menominee by Ambulatory Disability
In terms of ambulatory disability, the demographic groups most similar to Menominee are Cajun (7.8%, a difference of 0.28%), Cherokee (7.9%, a difference of 0.89%), Paiute (7.7%, a difference of 1.5%), Yuman (7.9%, a difference of 1.8%), and Pueblo (7.6%, a difference of 2.7%).
| Demographics | Rating | Rank | Ambulatory Disability |
| Comanche | 0.0 /100 | #325 | Tragic 7.5% |
| Blacks/African Americans | 0.0 /100 | #326 | Tragic 7.5% |
| Natives/Alaskans | 0.0 /100 | #327 | Tragic 7.5% |
| Hopi | 0.0 /100 | #328 | Tragic 7.6% |
| Pueblo | 0.0 /100 | #329 | Tragic 7.6% |
| Paiute | 0.0 /100 | #330 | Tragic 7.7% |
| Cajuns | 0.0 /100 | #331 | Tragic 7.8% |
| Menominee | 0.0 /100 | #332 | Tragic 7.8% |
| Cherokee | 0.0 /100 | #333 | Tragic 7.9% |
| Yuman | 0.0 /100 | #334 | Tragic 7.9% |
| Chickasaw | 0.0 /100 | #335 | Tragic 8.0% |
| Seminole | 0.0 /100 | #336 | Tragic 8.0% |
| Dutch West Indians | 0.0 /100 | #337 | Tragic 8.2% |
| Colville | 0.0 /100 | #338 | Tragic 8.2% |
| Pima | 0.0 /100 | #339 | Tragic 8.2% |