Immigrants from Norway vs British West Indian Self-Care Disability
COMPARE
Immigrants from Norway
British West Indian
Self-Care Disability
Self-Care Disability Comparison
Immigrants from Norway
British West Indians
2.3%
SELF-CARE DISABILITY
99.2/ 100
METRIC RATING
69th/ 347
METRIC RANK
2.8%
SELF-CARE DISABILITY
0.0/ 100
METRIC RATING
310th/ 347
METRIC RANK
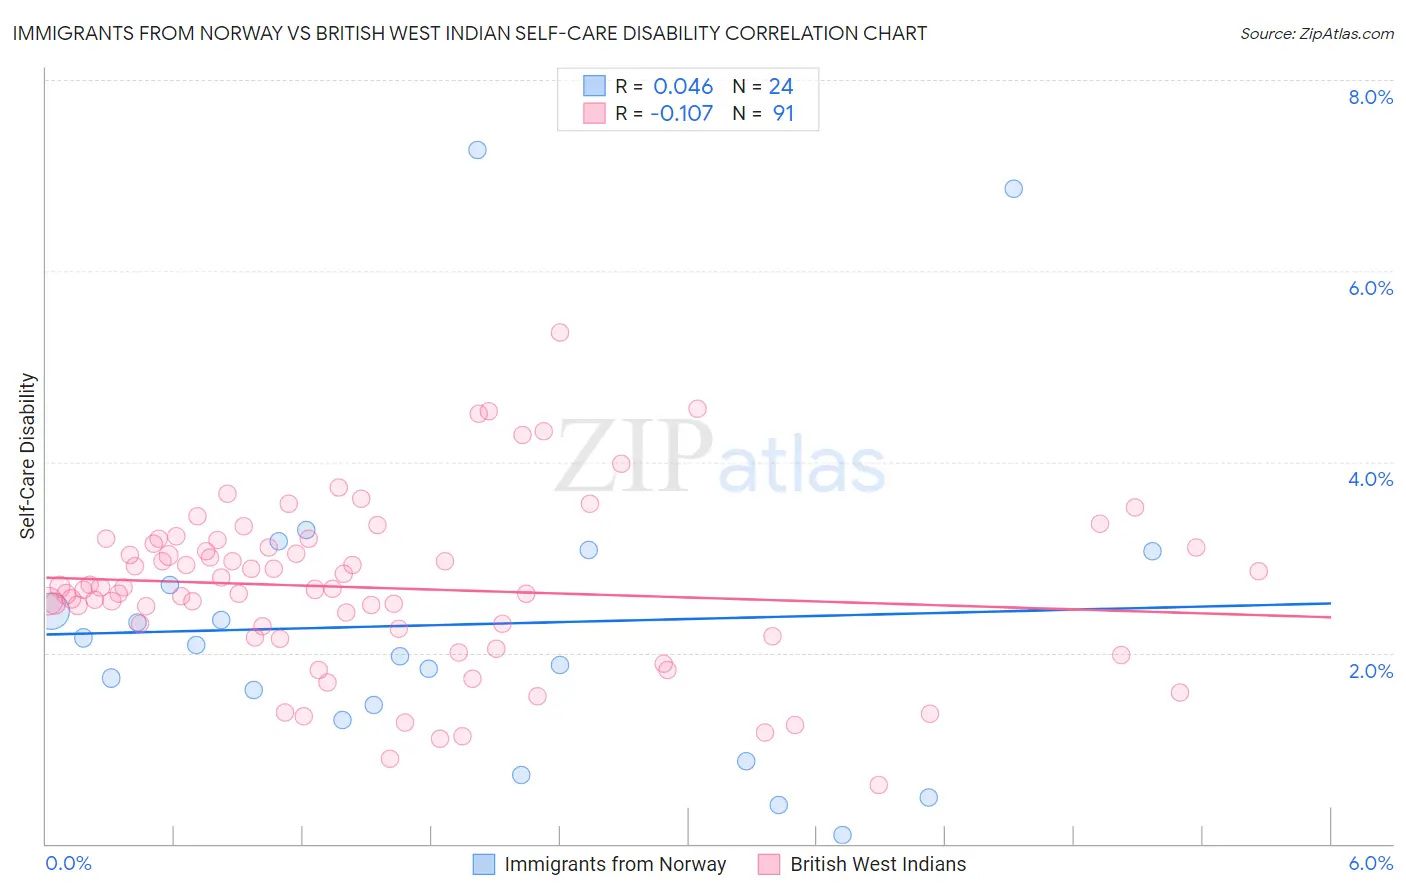
Immigrants from Norway vs British West Indian Self-Care Disability Correlation Chart
The statistical analysis conducted on geographies consisting of 116,682,043 people shows no correlation between the proportion of Immigrants from Norway and percentage of population with self-care disability in the United States with a correlation coefficient (R) of 0.046 and weighted average of 2.3%. Similarly, the statistical analysis conducted on geographies consisting of 152,617,328 people shows a poor negative correlation between the proportion of British West Indians and percentage of population with self-care disability in the United States with a correlation coefficient (R) of -0.107 and weighted average of 2.8%, a difference of 21.4%.
Self-Care Disability Correlation Summary
| Measurement | Immigrants from Norway | British West Indian |
| Minimum | 0.094% | 0.62% |
| Maximum | 7.3% | 5.4% |
| Range | 7.2% | 4.7% |
| Mean | 2.3% | 2.7% |
| Median | 2.0% | 2.7% |
| Interquartile 25% (IQ1) | 1.4% | 2.2% |
| Interquartile 75% (IQ3) | 2.9% | 3.1% |
| Interquartile Range (IQR) | 1.5% | 0.97% |
| Standard Deviation (Sample) | 1.7% | 0.87% |
| Standard Deviation (Population) | 1.7% | 0.86% |
Similar Demographics by Self-Care Disability
Demographics Similar to Immigrants from Norway by Self-Care Disability
In terms of self-care disability, the demographic groups most similar to Immigrants from Norway are Immigrants from Zaire (2.3%, a difference of 0.0%), Immigrants from Northern Europe (2.3%, a difference of 0.040%), Asian (2.3%, a difference of 0.070%), South African (2.3%, a difference of 0.090%), and Eastern European (2.3%, a difference of 0.10%).
| Demographics | Rating | Rank | Self-Care Disability |
| Egyptians | 99.4 /100 | #62 | Exceptional 2.3% |
| Mongolians | 99.3 /100 | #63 | Exceptional 2.3% |
| Swedes | 99.3 /100 | #64 | Exceptional 2.3% |
| Brazilians | 99.3 /100 | #65 | Exceptional 2.3% |
| Immigrants | Argentina | 99.3 /100 | #66 | Exceptional 2.3% |
| South Africans | 99.3 /100 | #67 | Exceptional 2.3% |
| Immigrants | Zaire | 99.2 /100 | #68 | Exceptional 2.3% |
| Immigrants | Norway | 99.2 /100 | #69 | Exceptional 2.3% |
| Immigrants | Northern Europe | 99.2 /100 | #70 | Exceptional 2.3% |
| Asians | 99.2 /100 | #71 | Exceptional 2.3% |
| Eastern Europeans | 99.2 /100 | #72 | Exceptional 2.3% |
| Immigrants | Egypt | 99.1 /100 | #73 | Exceptional 2.3% |
| Immigrants | Switzerland | 99.1 /100 | #74 | Exceptional 2.3% |
| Immigrants | Netherlands | 99.1 /100 | #75 | Exceptional 2.3% |
| Immigrants | China | 99.1 /100 | #76 | Exceptional 2.3% |
Demographics Similar to British West Indians by Self-Care Disability
In terms of self-care disability, the demographic groups most similar to British West Indians are Puget Sound Salish (2.8%, a difference of 0.070%), Bangladeshi (2.8%, a difference of 0.10%), Immigrants from Grenada (2.8%, a difference of 0.25%), Immigrants from Caribbean (2.8%, a difference of 0.26%), and Spanish American (2.8%, a difference of 0.30%).
| Demographics | Rating | Rank | Self-Care Disability |
| Immigrants | Belize | 0.0 /100 | #303 | Tragic 2.8% |
| Cree | 0.0 /100 | #304 | Tragic 2.8% |
| Immigrants | West Indies | 0.0 /100 | #305 | Tragic 2.8% |
| Aleuts | 0.0 /100 | #306 | Tragic 2.8% |
| Natives/Alaskans | 0.0 /100 | #307 | Tragic 2.8% |
| Immigrants | Grenada | 0.0 /100 | #308 | Tragic 2.8% |
| Bangladeshis | 0.0 /100 | #309 | Tragic 2.8% |
| British West Indians | 0.0 /100 | #310 | Tragic 2.8% |
| Puget Sound Salish | 0.0 /100 | #311 | Tragic 2.8% |
| Immigrants | Caribbean | 0.0 /100 | #312 | Tragic 2.8% |
| Spanish Americans | 0.0 /100 | #313 | Tragic 2.8% |
| Creek | 0.0 /100 | #314 | Tragic 2.8% |
| Immigrants | Cuba | 0.0 /100 | #315 | Tragic 2.8% |
| Menominee | 0.0 /100 | #316 | Tragic 2.8% |
| Immigrants | Dominica | 0.0 /100 | #317 | Tragic 2.8% |