Immigrants from Norway vs Immigrants from Iraq Female Disability
COMPARE
Immigrants from Norway
Immigrants from Iraq
Female Disability
Female Disability Comparison
Immigrants from Norway
Immigrants from Iraq
11.9%
FEMALE DISABILITY
93.8/ 100
METRIC RATING
137th/ 347
METRIC RANK
12.5%
FEMALE DISABILITY
5.3/ 100
METRIC RATING
233rd/ 347
METRIC RANK
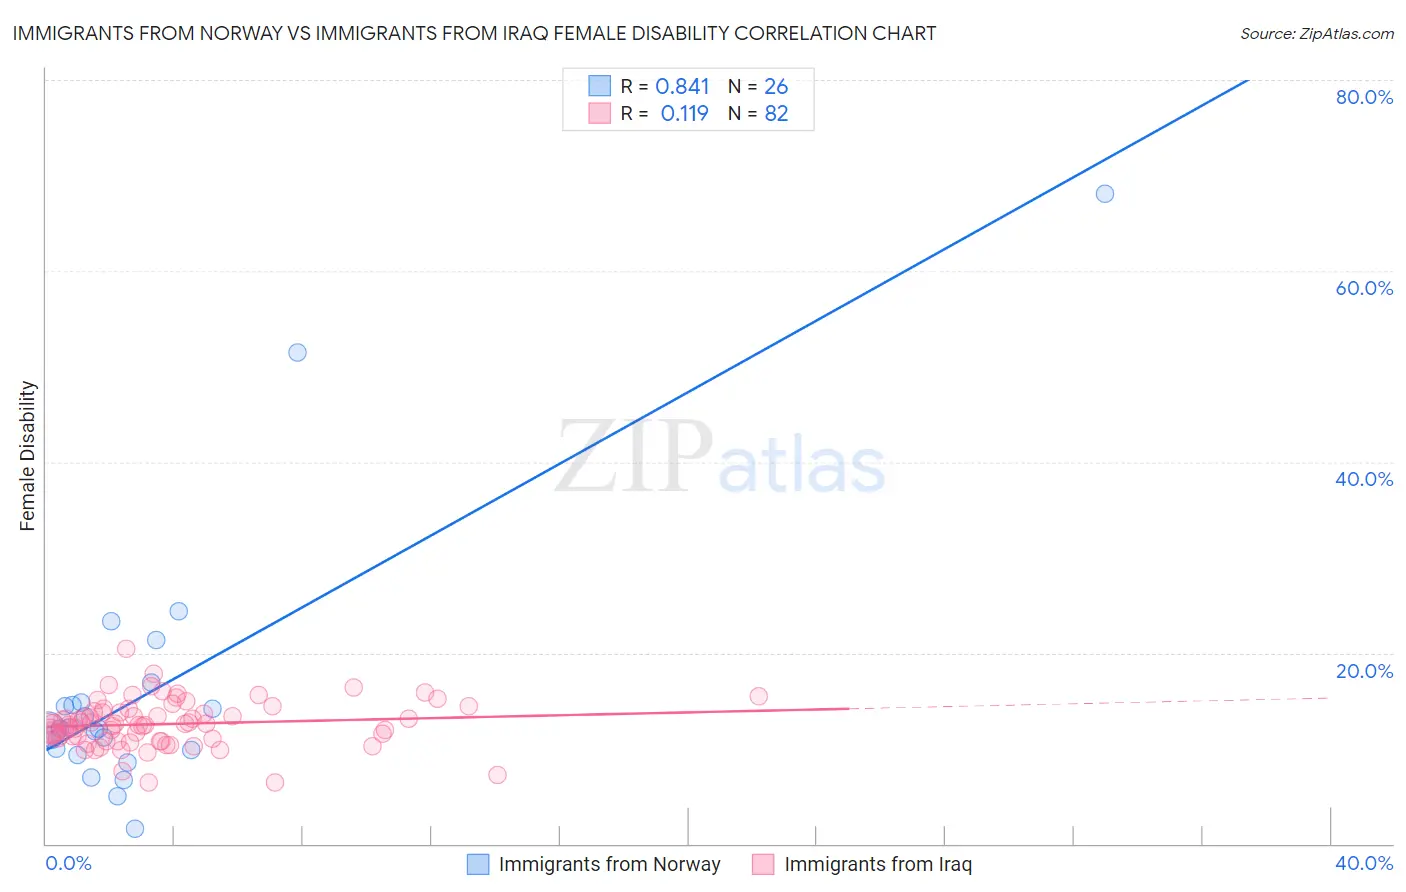
Immigrants from Norway vs Immigrants from Iraq Female Disability Correlation Chart
The statistical analysis conducted on geographies consisting of 116,702,841 people shows a very strong positive correlation between the proportion of Immigrants from Norway and percentage of females with a disability in the United States with a correlation coefficient (R) of 0.841 and weighted average of 11.9%. Similarly, the statistical analysis conducted on geographies consisting of 194,760,840 people shows a poor positive correlation between the proportion of Immigrants from Iraq and percentage of females with a disability in the United States with a correlation coefficient (R) of 0.119 and weighted average of 12.5%, a difference of 5.4%.
Female Disability Correlation Summary
| Measurement | Immigrants from Norway | Immigrants from Iraq |
| Minimum | 1.5% | 6.4% |
| Maximum | 68.1% | 20.5% |
| Range | 66.6% | 14.1% |
| Mean | 16.0% | 12.5% |
| Median | 12.0% | 12.5% |
| Interquartile 25% (IQ1) | 9.8% | 10.9% |
| Interquartile 75% (IQ3) | 14.8% | 13.8% |
| Interquartile Range (IQR) | 5.0% | 2.9% |
| Standard Deviation (Sample) | 14.1% | 2.4% |
| Standard Deviation (Population) | 13.8% | 2.4% |
Similar Demographics by Female Disability
Demographics Similar to Immigrants from Norway by Female Disability
In terms of female disability, the demographic groups most similar to Immigrants from Norway are Ugandan (11.9%, a difference of 0.040%), Central American (11.9%, a difference of 0.060%), Ecuadorian (11.9%, a difference of 0.060%), Kenyan (11.9%, a difference of 0.13%), and Immigrants from Nicaragua (11.9%, a difference of 0.13%).
| Demographics | Rating | Rank | Female Disability |
| Nicaraguans | 95.2 /100 | #130 | Exceptional 11.9% |
| Arabs | 95.1 /100 | #131 | Exceptional 11.9% |
| Immigrants | Syria | 94.6 /100 | #132 | Exceptional 11.9% |
| Kenyans | 94.5 /100 | #133 | Exceptional 11.9% |
| Immigrants | Nicaragua | 94.5 /100 | #134 | Exceptional 11.9% |
| Central Americans | 94.2 /100 | #135 | Exceptional 11.9% |
| Ugandans | 94.0 /100 | #136 | Exceptional 11.9% |
| Immigrants | Norway | 93.8 /100 | #137 | Exceptional 11.9% |
| Ecuadorians | 93.4 /100 | #138 | Exceptional 11.9% |
| Immigrants | Hungary | 92.8 /100 | #139 | Exceptional 11.9% |
| Romanians | 91.6 /100 | #140 | Exceptional 11.9% |
| Immigrants | Ecuador | 91.5 /100 | #141 | Exceptional 11.9% |
| Immigrants | Africa | 90.0 /100 | #142 | Excellent 11.9% |
| Immigrants | Sudan | 89.6 /100 | #143 | Excellent 11.9% |
| Immigrants | Austria | 87.9 /100 | #144 | Excellent 12.0% |
Demographics Similar to Immigrants from Iraq by Female Disability
In terms of female disability, the demographic groups most similar to Immigrants from Iraq are Scandinavian (12.5%, a difference of 0.010%), Malaysian (12.5%, a difference of 0.060%), Immigrants from Somalia (12.5%, a difference of 0.10%), Belgian (12.5%, a difference of 0.19%), and Immigrants from West Indies (12.6%, a difference of 0.19%).
| Demographics | Rating | Rank | Female Disability |
| Hispanics or Latinos | 8.0 /100 | #226 | Tragic 12.5% |
| Assyrians/Chaldeans/Syriacs | 8.0 /100 | #227 | Tragic 12.5% |
| Immigrants | Cambodia | 7.8 /100 | #228 | Tragic 12.5% |
| Hungarians | 7.2 /100 | #229 | Tragic 12.5% |
| Immigrants | Belize | 7.0 /100 | #230 | Tragic 12.5% |
| Belgians | 6.5 /100 | #231 | Tragic 12.5% |
| Immigrants | Somalia | 5.9 /100 | #232 | Tragic 12.5% |
| Immigrants | Iraq | 5.3 /100 | #233 | Tragic 12.5% |
| Scandinavians | 5.3 /100 | #234 | Tragic 12.5% |
| Malaysians | 5.0 /100 | #235 | Tragic 12.5% |
| Immigrants | West Indies | 4.4 /100 | #236 | Tragic 12.6% |
| Slavs | 3.8 /100 | #237 | Tragic 12.6% |
| Yugoslavians | 3.7 /100 | #238 | Tragic 12.6% |
| Barbadians | 3.6 /100 | #239 | Tragic 12.6% |
| German Russians | 3.2 /100 | #240 | Tragic 12.6% |