Immigrants from Northern Europe vs Danish Disability
COMPARE
Immigrants from Northern Europe
Danish
Disability
Disability Comparison
Immigrants from Northern Europe
Danes
11.3%
DISABILITY
94.1/ 100
METRIC RATING
116th/ 347
METRIC RANK
12.0%
DISABILITY
8.7/ 100
METRIC RATING
209th/ 347
METRIC RANK
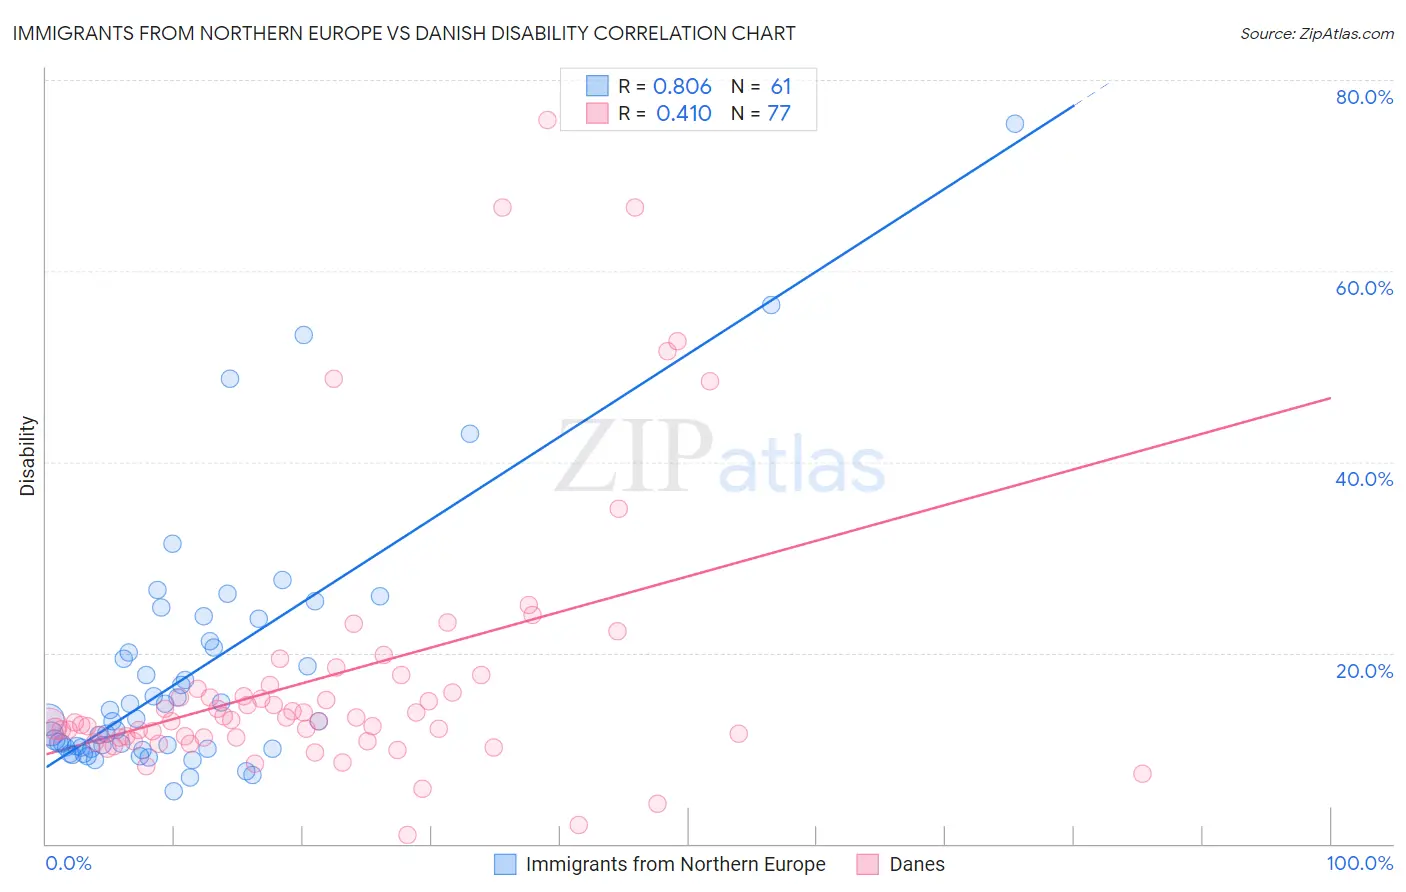
Immigrants from Northern Europe vs Danish Disability Correlation Chart
The statistical analysis conducted on geographies consisting of 477,212,072 people shows a very strong positive correlation between the proportion of Immigrants from Northern Europe and percentage of population with a disability in the United States with a correlation coefficient (R) of 0.806 and weighted average of 11.3%. Similarly, the statistical analysis conducted on geographies consisting of 474,128,503 people shows a moderate positive correlation between the proportion of Danes and percentage of population with a disability in the United States with a correlation coefficient (R) of 0.410 and weighted average of 12.0%, a difference of 5.9%.
Disability Correlation Summary
| Measurement | Immigrants from Northern Europe | Danish |
| Minimum | 5.5% | 0.97% |
| Maximum | 75.4% | 75.8% |
| Range | 69.9% | 74.8% |
| Mean | 17.8% | 17.5% |
| Median | 12.9% | 12.9% |
| Interquartile 25% (IQ1) | 10.0% | 11.1% |
| Interquartile 75% (IQ3) | 20.9% | 16.5% |
| Interquartile Range (IQR) | 10.9% | 5.4% |
| Standard Deviation (Sample) | 13.2% | 14.3% |
| Standard Deviation (Population) | 13.1% | 14.2% |
Similar Demographics by Disability
Demographics Similar to Immigrants from Northern Europe by Disability
In terms of disability, the demographic groups most similar to Immigrants from Northern Europe are Luxembourger (11.3%, a difference of 0.060%), Korean (11.3%, a difference of 0.070%), Immigrants from Philippines (11.3%, a difference of 0.11%), Central American (11.4%, a difference of 0.12%), and Immigrants from North Macedonia (11.4%, a difference of 0.12%).
| Demographics | Rating | Rank | Disability |
| Immigrants | Uganda | 95.7 /100 | #109 | Exceptional 11.3% |
| Immigrants | Denmark | 95.6 /100 | #110 | Exceptional 11.3% |
| Immigrants | South Eastern Asia | 95.4 /100 | #111 | Exceptional 11.3% |
| Immigrants | Uzbekistan | 94.9 /100 | #112 | Exceptional 11.3% |
| Guyanese | 94.7 /100 | #113 | Exceptional 11.3% |
| Immigrants | Syria | 94.7 /100 | #114 | Exceptional 11.3% |
| Immigrants | Philippines | 94.6 /100 | #115 | Exceptional 11.3% |
| Immigrants | Northern Europe | 94.1 /100 | #116 | Exceptional 11.3% |
| Luxembourgers | 93.9 /100 | #117 | Exceptional 11.3% |
| Koreans | 93.8 /100 | #118 | Exceptional 11.3% |
| Central Americans | 93.5 /100 | #119 | Exceptional 11.4% |
| Immigrants | North Macedonia | 93.5 /100 | #120 | Exceptional 11.4% |
| Immigrants | Costa Rica | 93.4 /100 | #121 | Exceptional 11.4% |
| Brazilians | 93.3 /100 | #122 | Exceptional 11.4% |
| South Africans | 92.3 /100 | #123 | Exceptional 11.4% |
Demographics Similar to Danes by Disability
In terms of disability, the demographic groups most similar to Danes are Immigrants from Caribbean (12.0%, a difference of 0.050%), Immigrants from Thailand (12.0%, a difference of 0.070%), Immigrants from Senegal (12.0%, a difference of 0.080%), Czech (12.0%, a difference of 0.13%), and Immigrants from Western Europe (12.0%, a difference of 0.17%).
| Demographics | Rating | Rank | Disability |
| Immigrants | England | 12.0 /100 | #202 | Poor 12.0% |
| British West Indians | 11.5 /100 | #203 | Poor 12.0% |
| Mexican American Indians | 11.4 /100 | #204 | Poor 12.0% |
| Immigrants | Western Europe | 10.1 /100 | #205 | Poor 12.0% |
| Immigrants | Senegal | 9.4 /100 | #206 | Tragic 12.0% |
| Immigrants | Thailand | 9.3 /100 | #207 | Tragic 12.0% |
| Immigrants | Caribbean | 9.1 /100 | #208 | Tragic 12.0% |
| Danes | 8.7 /100 | #209 | Tragic 12.0% |
| Czechs | 7.9 /100 | #210 | Tragic 12.0% |
| Immigrants | Cambodia | 7.3 /100 | #211 | Tragic 12.0% |
| Austrians | 7.2 /100 | #212 | Tragic 12.0% |
| Immigrants | Iraq | 7.1 /100 | #213 | Tragic 12.0% |
| Immigrants | Somalia | 6.8 /100 | #214 | Tragic 12.0% |
| Immigrants | Canada | 6.1 /100 | #215 | Tragic 12.1% |
| Panamanians | 5.4 /100 | #216 | Tragic 12.1% |