Immigrants from North Macedonia vs Scandinavian Male Disability
COMPARE
Immigrants from North Macedonia
Scandinavian
Male Disability
Male Disability Comparison
Immigrants from North Macedonia
Scandinavians
10.9%
MALE DISABILITY
88.1/ 100
METRIC RATING
125th/ 347
METRIC RANK
12.3%
MALE DISABILITY
0.1/ 100
METRIC RATING
271st/ 347
METRIC RANK
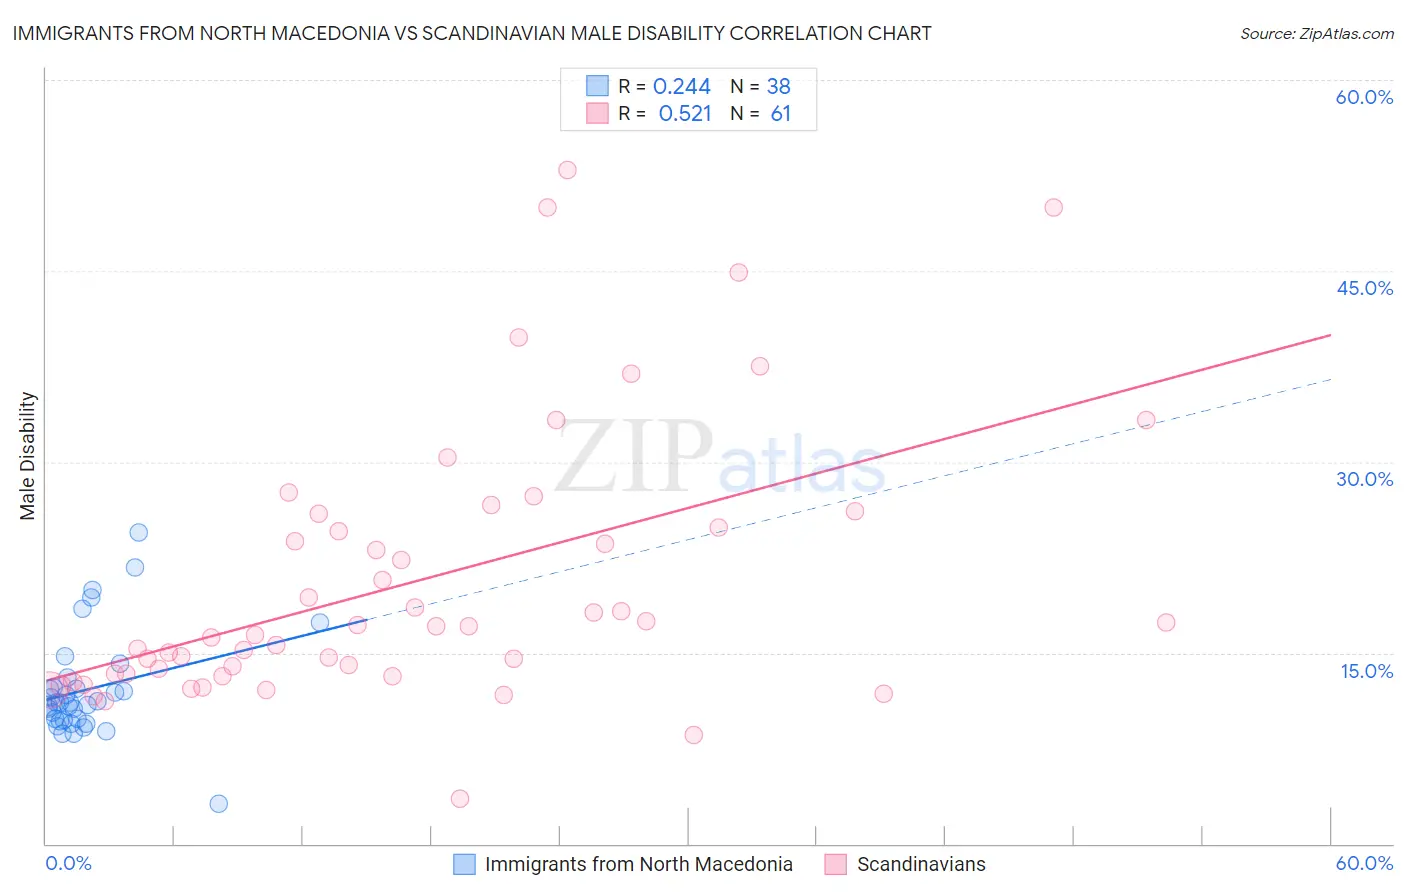
Immigrants from North Macedonia vs Scandinavian Male Disability Correlation Chart
The statistical analysis conducted on geographies consisting of 74,317,186 people shows a weak positive correlation between the proportion of Immigrants from North Macedonia and percentage of males with a disability in the United States with a correlation coefficient (R) of 0.244 and weighted average of 10.9%. Similarly, the statistical analysis conducted on geographies consisting of 472,512,703 people shows a substantial positive correlation between the proportion of Scandinavians and percentage of males with a disability in the United States with a correlation coefficient (R) of 0.521 and weighted average of 12.3%, a difference of 13.0%.
Male Disability Correlation Summary
| Measurement | Immigrants from North Macedonia | Scandinavian |
| Minimum | 3.1% | 3.5% |
| Maximum | 24.4% | 52.9% |
| Range | 21.3% | 49.4% |
| Mean | 12.1% | 20.6% |
| Median | 11.1% | 17.0% |
| Interquartile 25% (IQ1) | 9.7% | 13.3% |
| Interquartile 75% (IQ3) | 12.3% | 25.4% |
| Interquartile Range (IQR) | 2.6% | 12.1% |
| Standard Deviation (Sample) | 4.1% | 10.7% |
| Standard Deviation (Population) | 4.1% | 10.7% |
Similar Demographics by Male Disability
Demographics Similar to Immigrants from North Macedonia by Male Disability
In terms of male disability, the demographic groups most similar to Immigrants from North Macedonia are South American Indian (10.9%, a difference of 0.0%), Immigrants from Czechoslovakia (10.9%, a difference of 0.040%), Immigrants from Ghana (10.9%, a difference of 0.14%), Immigrants from South Eastern Asia (10.9%, a difference of 0.15%), and Immigrants from Trinidad and Tobago (10.9%, a difference of 0.16%).
| Demographics | Rating | Rank | Male Disability |
| Immigrants | Cuba | 90.2 /100 | #118 | Exceptional 10.9% |
| Armenians | 90.1 /100 | #119 | Exceptional 10.9% |
| Immigrants | Africa | 89.4 /100 | #120 | Excellent 10.9% |
| Immigrants | South Eastern Asia | 89.2 /100 | #121 | Excellent 10.9% |
| Immigrants | Ghana | 89.0 /100 | #122 | Excellent 10.9% |
| Immigrants | Czechoslovakia | 88.4 /100 | #123 | Excellent 10.9% |
| South American Indians | 88.1 /100 | #124 | Excellent 10.9% |
| Immigrants | North Macedonia | 88.1 /100 | #125 | Excellent 10.9% |
| Immigrants | Trinidad and Tobago | 86.9 /100 | #126 | Excellent 10.9% |
| Immigrants | Ukraine | 86.8 /100 | #127 | Excellent 10.9% |
| Immigrants | Latvia | 85.5 /100 | #128 | Excellent 10.9% |
| Immigrants | Philippines | 85.4 /100 | #129 | Excellent 10.9% |
| Brazilians | 85.4 /100 | #130 | Excellent 10.9% |
| Macedonians | 84.2 /100 | #131 | Excellent 11.0% |
| Immigrants | Fiji | 84.0 /100 | #132 | Excellent 11.0% |
Demographics Similar to Scandinavians by Male Disability
In terms of male disability, the demographic groups most similar to Scandinavians are Spaniard (12.3%, a difference of 0.19%), Portuguese (12.3%, a difference of 0.27%), Czechoslovakian (12.3%, a difference of 0.27%), Immigrants from Germany (12.3%, a difference of 0.40%), and Hawaiian (12.3%, a difference of 0.45%).
| Demographics | Rating | Rank | Male Disability |
| Nepalese | 0.2 /100 | #264 | Tragic 12.2% |
| Immigrants | Portugal | 0.1 /100 | #265 | Tragic 12.3% |
| Hawaiians | 0.1 /100 | #266 | Tragic 12.3% |
| Immigrants | Germany | 0.1 /100 | #267 | Tragic 12.3% |
| Portuguese | 0.1 /100 | #268 | Tragic 12.3% |
| Czechoslovakians | 0.1 /100 | #269 | Tragic 12.3% |
| Spaniards | 0.1 /100 | #270 | Tragic 12.3% |
| Scandinavians | 0.1 /100 | #271 | Tragic 12.3% |
| Hmong | 0.0 /100 | #272 | Tragic 12.5% |
| Native Hawaiians | 0.0 /100 | #273 | Tragic 12.5% |
| Hopi | 0.0 /100 | #274 | Tragic 12.5% |
| Fijians | 0.0 /100 | #275 | Tragic 12.6% |
| Africans | 0.0 /100 | #276 | Tragic 12.6% |
| Finns | 0.0 /100 | #277 | Tragic 12.6% |
| Central American Indians | 0.0 /100 | #278 | Tragic 12.7% |