Immigrants from Nicaragua vs Immigrants from Saudi Arabia Hearing Disability
COMPARE
Immigrants from Nicaragua
Immigrants from Saudi Arabia
Hearing Disability
Hearing Disability Comparison
Immigrants from Nicaragua
Immigrants from Saudi Arabia
2.7%
HEARING DISABILITY
99.0/ 100
METRIC RATING
56th/ 347
METRIC RANK
2.7%
HEARING DISABILITY
97.5/ 100
METRIC RATING
75th/ 347
METRIC RANK
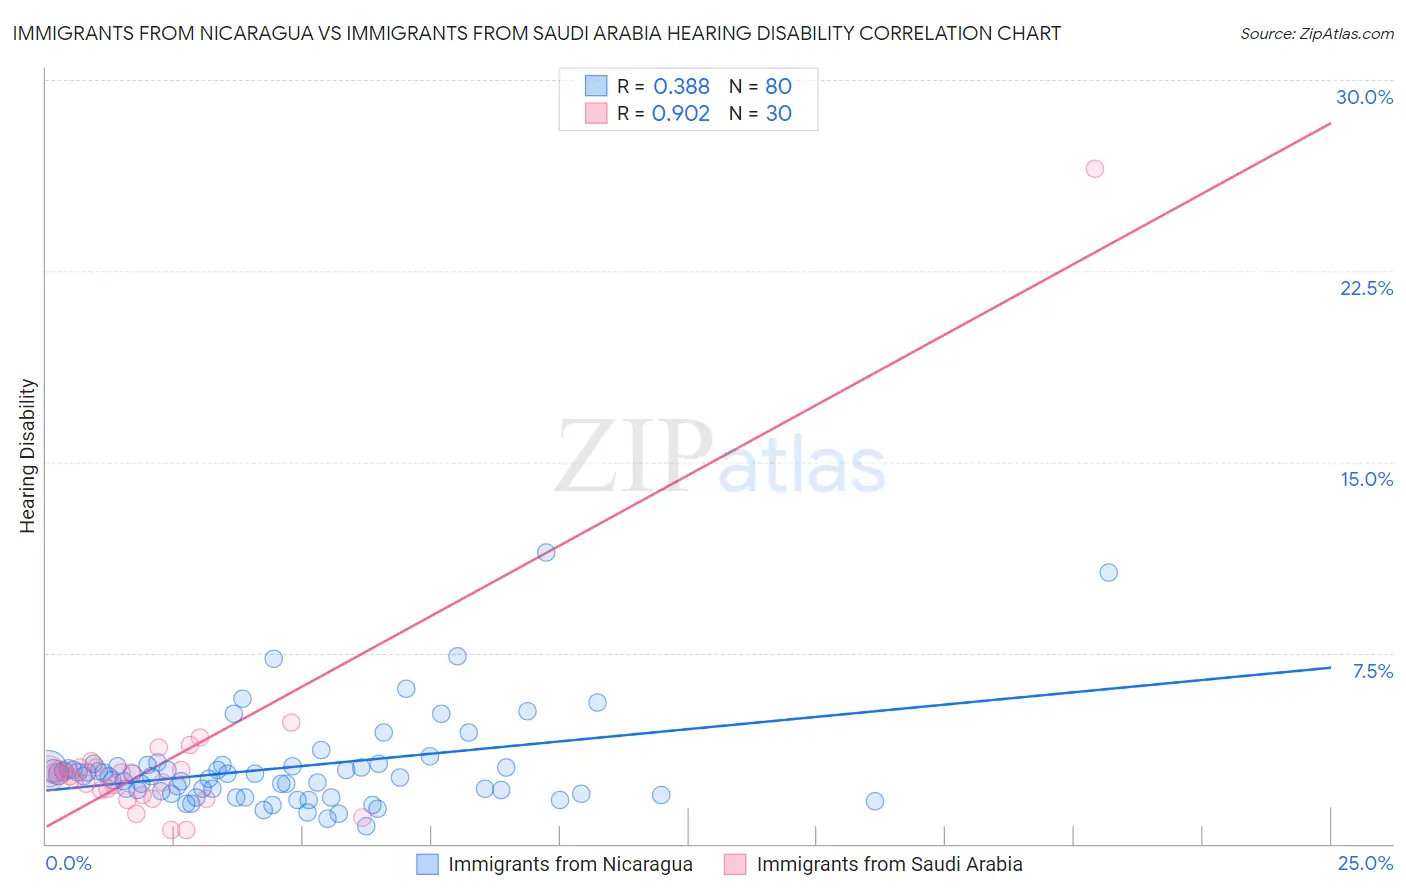
Immigrants from Nicaragua vs Immigrants from Saudi Arabia Hearing Disability Correlation Chart
The statistical analysis conducted on geographies consisting of 236,296,931 people shows a mild positive correlation between the proportion of Immigrants from Nicaragua and percentage of population with hearing disability in the United States with a correlation coefficient (R) of 0.388 and weighted average of 2.7%. Similarly, the statistical analysis conducted on geographies consisting of 164,279,608 people shows a near-perfect positive correlation between the proportion of Immigrants from Saudi Arabia and percentage of population with hearing disability in the United States with a correlation coefficient (R) of 0.902 and weighted average of 2.7%, a difference of 2.4%.
Hearing Disability Correlation Summary
| Measurement | Immigrants from Nicaragua | Immigrants from Saudi Arabia |
| Minimum | 0.69% | 0.52% |
| Maximum | 11.4% | 26.5% |
| Range | 10.7% | 26.0% |
| Mean | 3.0% | 3.3% |
| Median | 2.6% | 2.7% |
| Interquartile 25% (IQ1) | 1.9% | 1.9% |
| Interquartile 75% (IQ3) | 3.0% | 3.0% |
| Interquartile Range (IQR) | 1.1% | 1.1% |
| Standard Deviation (Sample) | 1.8% | 4.5% |
| Standard Deviation (Population) | 1.8% | 4.4% |
Demographics Similar to Immigrants from Nicaragua and Immigrants from Saudi Arabia by Hearing Disability
In terms of hearing disability, the demographic groups most similar to Immigrants from Nicaragua are Immigrants from Ethiopia (2.7%, a difference of 0.020%), South American (2.7%, a difference of 0.040%), Immigrants from Peru (2.7%, a difference of 0.81%), Immigrants from Eritrea (2.7%, a difference of 0.92%), and Immigrants from Egypt (2.7%, a difference of 0.99%). Similarly, the demographic groups most similar to Immigrants from Saudi Arabia are Argentinean (2.7%, a difference of 0.030%), Immigrants from Korea (2.7%, a difference of 0.030%), Afghan (2.7%, a difference of 0.11%), Central American (2.7%, a difference of 0.21%), and Peruvian (2.7%, a difference of 0.26%).
| Demographics | Rating | Rank | Hearing Disability |
| Immigrants | Ethiopia | 99.0 /100 | #55 | Exceptional 2.7% |
| Immigrants | Nicaragua | 99.0 /100 | #56 | Exceptional 2.7% |
| South Americans | 99.0 /100 | #57 | Exceptional 2.7% |
| Immigrants | Peru | 98.6 /100 | #58 | Exceptional 2.7% |
| Immigrants | Eritrea | 98.5 /100 | #59 | Exceptional 2.7% |
| Immigrants | Egypt | 98.5 /100 | #60 | Exceptional 2.7% |
| Immigrants | Uzbekistan | 98.4 /100 | #61 | Exceptional 2.7% |
| Immigrants | Colombia | 98.4 /100 | #62 | Exceptional 2.7% |
| Indians (Asian) | 98.4 /100 | #63 | Exceptional 2.7% |
| Immigrants | Sri Lanka | 98.4 /100 | #64 | Exceptional 2.7% |
| Immigrants | Nepal | 98.3 /100 | #65 | Exceptional 2.7% |
| Immigrants | Belize | 98.2 /100 | #66 | Exceptional 2.7% |
| Egyptians | 98.1 /100 | #67 | Exceptional 2.7% |
| Immigrants | Africa | 98.0 /100 | #68 | Exceptional 2.7% |
| Nicaraguans | 97.9 /100 | #69 | Exceptional 2.7% |
| Peruvians | 97.7 /100 | #70 | Exceptional 2.7% |
| Central Americans | 97.7 /100 | #71 | Exceptional 2.7% |
| Afghans | 97.6 /100 | #72 | Exceptional 2.7% |
| Argentineans | 97.5 /100 | #73 | Exceptional 2.7% |
| Immigrants | Korea | 97.5 /100 | #74 | Exceptional 2.7% |
| Immigrants | Saudi Arabia | 97.5 /100 | #75 | Exceptional 2.7% |