Immigrants from Nicaragua vs Immigrants from Asia Disability
COMPARE
Immigrants from Nicaragua
Immigrants from Asia
Disability
Disability Comparison
Immigrants from Nicaragua
Immigrants from Asia
11.3%
DISABILITY
96.8/ 100
METRIC RATING
101st/ 347
METRIC RANK
10.5%
DISABILITY
100.0/ 100
METRIC RATING
23rd/ 347
METRIC RANK
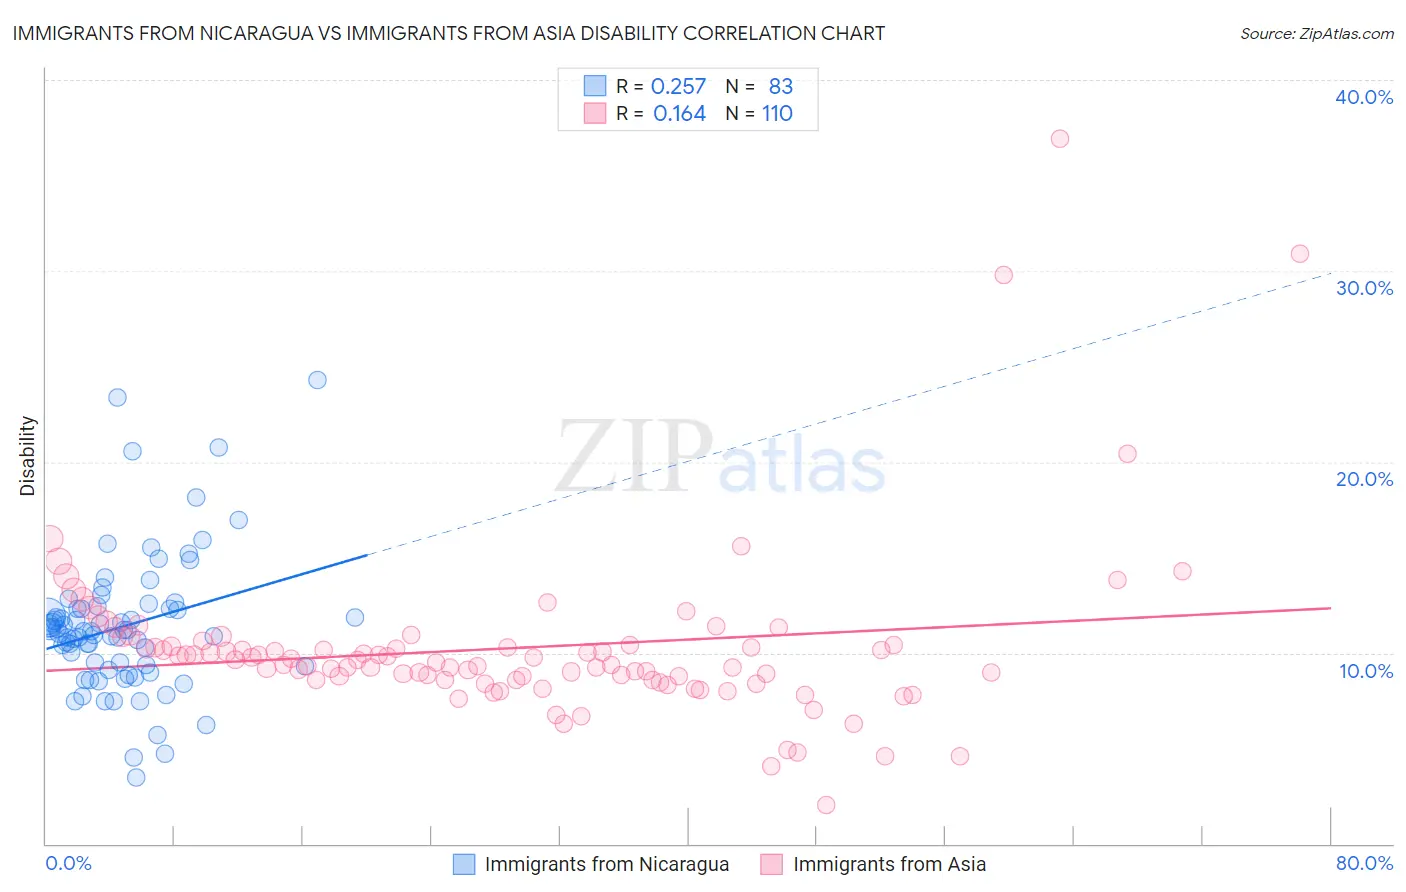
Immigrants from Nicaragua vs Immigrants from Asia Disability Correlation Chart
The statistical analysis conducted on geographies consisting of 236,329,178 people shows a weak positive correlation between the proportion of Immigrants from Nicaragua and percentage of population with a disability in the United States with a correlation coefficient (R) of 0.257 and weighted average of 11.3%. Similarly, the statistical analysis conducted on geographies consisting of 549,063,947 people shows a poor positive correlation between the proportion of Immigrants from Asia and percentage of population with a disability in the United States with a correlation coefficient (R) of 0.164 and weighted average of 10.5%, a difference of 6.9%.
Disability Correlation Summary
| Measurement | Immigrants from Nicaragua | Immigrants from Asia |
| Minimum | 3.5% | 2.0% |
| Maximum | 24.3% | 36.9% |
| Range | 20.8% | 34.9% |
| Mean | 11.4% | 10.2% |
| Median | 11.1% | 9.6% |
| Interquartile 25% (IQ1) | 9.3% | 8.6% |
| Interquartile 75% (IQ3) | 12.3% | 10.4% |
| Interquartile Range (IQR) | 3.0% | 1.8% |
| Standard Deviation (Sample) | 3.6% | 4.5% |
| Standard Deviation (Population) | 3.6% | 4.5% |
Similar Demographics by Disability
Demographics Similar to Immigrants from Nicaragua by Disability
In terms of disability, the demographic groups most similar to Immigrants from Nicaragua are Immigrants from Greece (11.3%, a difference of 0.040%), Immigrants from Eastern Africa (11.3%, a difference of 0.060%), Immigrants from Uruguay (11.3%, a difference of 0.14%), Immigrants (11.3%, a difference of 0.14%), and Immigrants from Kazakhstan (11.3%, a difference of 0.15%).
| Demographics | Rating | Rank | Disability |
| Immigrants | Morocco | 97.8 /100 | #94 | Exceptional 11.2% |
| Eastern Europeans | 97.8 /100 | #95 | Exceptional 11.2% |
| Immigrants | Zimbabwe | 97.7 /100 | #96 | Exceptional 11.2% |
| Bhutanese | 97.4 /100 | #97 | Exceptional 11.2% |
| Uruguayans | 97.4 /100 | #98 | Exceptional 11.2% |
| Immigrants | Czechoslovakia | 97.4 /100 | #99 | Exceptional 11.2% |
| Immigrants | Greece | 96.9 /100 | #100 | Exceptional 11.3% |
| Immigrants | Nicaragua | 96.8 /100 | #101 | Exceptional 11.3% |
| Immigrants | Eastern Africa | 96.7 /100 | #102 | Exceptional 11.3% |
| Immigrants | Uruguay | 96.4 /100 | #103 | Exceptional 11.3% |
| Immigrants | Immigrants | 96.4 /100 | #104 | Exceptional 11.3% |
| Immigrants | Kazakhstan | 96.4 /100 | #105 | Exceptional 11.3% |
| Immigrants | Eastern Europe | 96.3 /100 | #106 | Exceptional 11.3% |
| Nicaraguans | 96.2 /100 | #107 | Exceptional 11.3% |
| Immigrants | Nigeria | 96.0 /100 | #108 | Exceptional 11.3% |
Demographics Similar to Immigrants from Asia by Disability
In terms of disability, the demographic groups most similar to Immigrants from Asia are Venezuelan (10.5%, a difference of 0.14%), Immigrants from Malaysia (10.6%, a difference of 0.52%), Argentinean (10.6%, a difference of 0.57%), Cypriot (10.6%, a difference of 0.58%), and Immigrants from Sri Lanka (10.5%, a difference of 0.69%).
| Demographics | Rating | Rank | Disability |
| Indians (Asian) | 100.0 /100 | #16 | Exceptional 10.3% |
| Immigrants | Iran | 100.0 /100 | #17 | Exceptional 10.3% |
| Burmese | 100.0 /100 | #18 | Exceptional 10.4% |
| Immigrants | Pakistan | 100.0 /100 | #19 | Exceptional 10.4% |
| Immigrants | Venezuela | 100.0 /100 | #20 | Exceptional 10.4% |
| Asians | 100.0 /100 | #21 | Exceptional 10.4% |
| Immigrants | Sri Lanka | 100.0 /100 | #22 | Exceptional 10.5% |
| Immigrants | Asia | 100.0 /100 | #23 | Exceptional 10.5% |
| Venezuelans | 100.0 /100 | #24 | Exceptional 10.5% |
| Immigrants | Malaysia | 100.0 /100 | #25 | Exceptional 10.6% |
| Argentineans | 100.0 /100 | #26 | Exceptional 10.6% |
| Cypriots | 100.0 /100 | #27 | Exceptional 10.6% |
| Egyptians | 100.0 /100 | #28 | Exceptional 10.6% |
| Immigrants | Argentina | 100.0 /100 | #29 | Exceptional 10.6% |
| Immigrants | Turkey | 100.0 /100 | #30 | Exceptional 10.6% |