Immigrants from Nicaragua vs Tlingit-Haida Disability
COMPARE
Immigrants from Nicaragua
Tlingit-Haida
Disability
Disability Comparison
Immigrants from Nicaragua
Tlingit-Haida
11.3%
DISABILITY
96.8/ 100
METRIC RATING
101st/ 347
METRIC RANK
13.5%
DISABILITY
0.0/ 100
METRIC RATING
309th/ 347
METRIC RANK
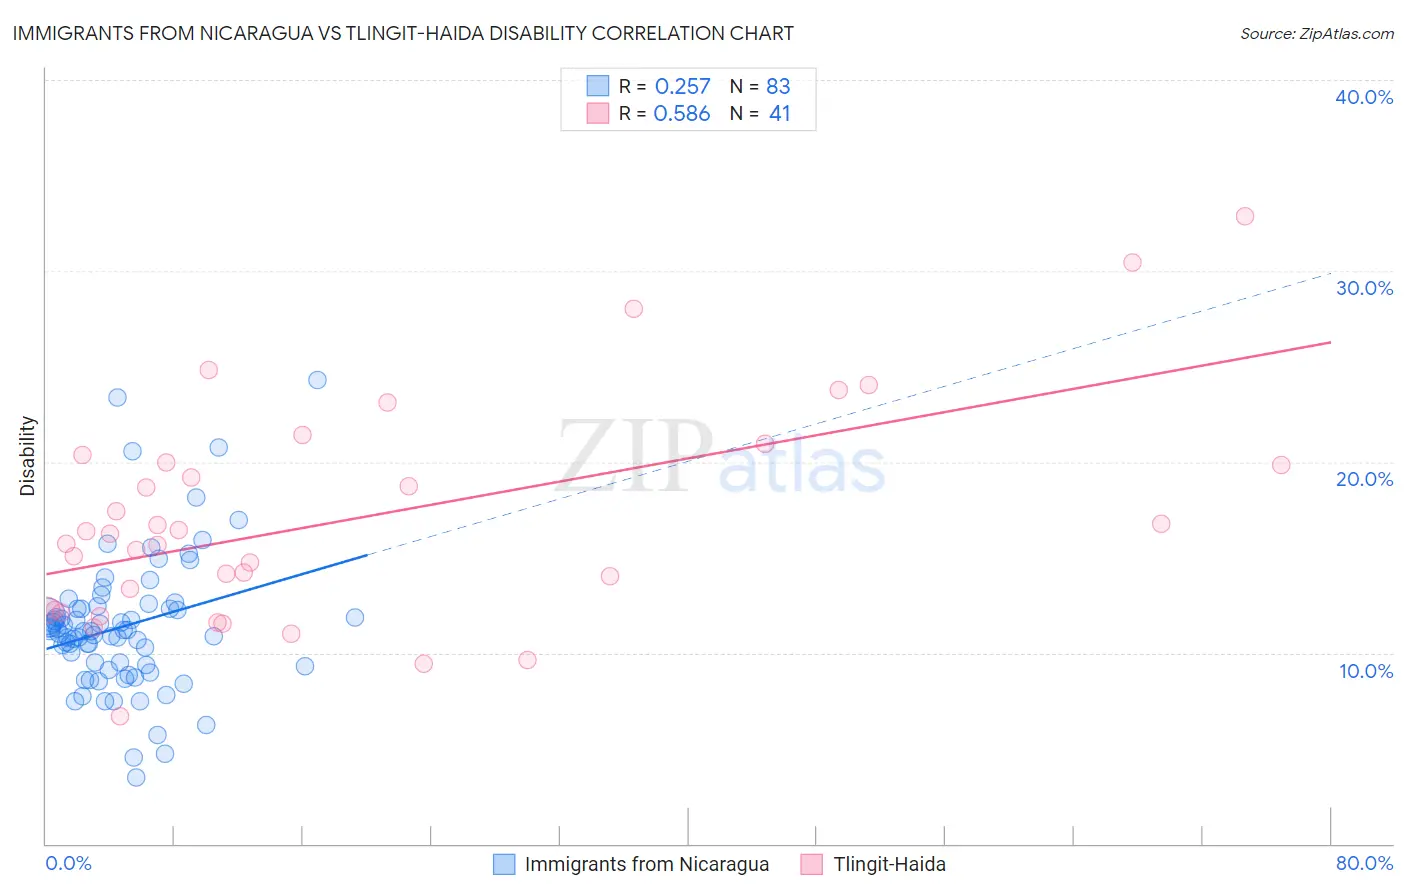
Immigrants from Nicaragua vs Tlingit-Haida Disability Correlation Chart
The statistical analysis conducted on geographies consisting of 236,329,178 people shows a weak positive correlation between the proportion of Immigrants from Nicaragua and percentage of population with a disability in the United States with a correlation coefficient (R) of 0.257 and weighted average of 11.3%. Similarly, the statistical analysis conducted on geographies consisting of 60,854,514 people shows a substantial positive correlation between the proportion of Tlingit-Haida and percentage of population with a disability in the United States with a correlation coefficient (R) of 0.586 and weighted average of 13.5%, a difference of 20.3%.
Disability Correlation Summary
| Measurement | Immigrants from Nicaragua | Tlingit-Haida |
| Minimum | 3.5% | 6.7% |
| Maximum | 24.3% | 32.8% |
| Range | 20.8% | 26.1% |
| Mean | 11.4% | 17.0% |
| Median | 11.1% | 16.3% |
| Interquartile 25% (IQ1) | 9.3% | 12.2% |
| Interquartile 75% (IQ3) | 12.3% | 20.2% |
| Interquartile Range (IQR) | 3.0% | 8.0% |
| Standard Deviation (Sample) | 3.6% | 5.7% |
| Standard Deviation (Population) | 3.6% | 5.7% |
Similar Demographics by Disability
Demographics Similar to Immigrants from Nicaragua by Disability
In terms of disability, the demographic groups most similar to Immigrants from Nicaragua are Immigrants from Greece (11.3%, a difference of 0.040%), Immigrants from Eastern Africa (11.3%, a difference of 0.060%), Immigrants from Uruguay (11.3%, a difference of 0.14%), Immigrants (11.3%, a difference of 0.14%), and Immigrants from Kazakhstan (11.3%, a difference of 0.15%).
| Demographics | Rating | Rank | Disability |
| Immigrants | Morocco | 97.8 /100 | #94 | Exceptional 11.2% |
| Eastern Europeans | 97.8 /100 | #95 | Exceptional 11.2% |
| Immigrants | Zimbabwe | 97.7 /100 | #96 | Exceptional 11.2% |
| Bhutanese | 97.4 /100 | #97 | Exceptional 11.2% |
| Uruguayans | 97.4 /100 | #98 | Exceptional 11.2% |
| Immigrants | Czechoslovakia | 97.4 /100 | #99 | Exceptional 11.2% |
| Immigrants | Greece | 96.9 /100 | #100 | Exceptional 11.3% |
| Immigrants | Nicaragua | 96.8 /100 | #101 | Exceptional 11.3% |
| Immigrants | Eastern Africa | 96.7 /100 | #102 | Exceptional 11.3% |
| Immigrants | Uruguay | 96.4 /100 | #103 | Exceptional 11.3% |
| Immigrants | Immigrants | 96.4 /100 | #104 | Exceptional 11.3% |
| Immigrants | Kazakhstan | 96.4 /100 | #105 | Exceptional 11.3% |
| Immigrants | Eastern Europe | 96.3 /100 | #106 | Exceptional 11.3% |
| Nicaraguans | 96.2 /100 | #107 | Exceptional 11.3% |
| Immigrants | Nigeria | 96.0 /100 | #108 | Exceptional 11.3% |
Demographics Similar to Tlingit-Haida by Disability
In terms of disability, the demographic groups most similar to Tlingit-Haida are French American Indian (13.5%, a difference of 0.080%), Shoshone (13.5%, a difference of 0.18%), Cape Verdean (13.5%, a difference of 0.23%), Blackfeet (13.6%, a difference of 0.53%), and Delaware (13.6%, a difference of 0.56%).
| Demographics | Rating | Rank | Disability |
| Arapaho | 0.0 /100 | #302 | Tragic 13.2% |
| Scotch-Irish | 0.0 /100 | #303 | Tragic 13.3% |
| Yakama | 0.0 /100 | #304 | Tragic 13.4% |
| French Canadians | 0.0 /100 | #305 | Tragic 13.4% |
| Cape Verdeans | 0.0 /100 | #306 | Tragic 13.5% |
| Shoshone | 0.0 /100 | #307 | Tragic 13.5% |
| French American Indians | 0.0 /100 | #308 | Tragic 13.5% |
| Tlingit-Haida | 0.0 /100 | #309 | Tragic 13.5% |
| Blackfeet | 0.0 /100 | #310 | Tragic 13.6% |
| Delaware | 0.0 /100 | #311 | Tragic 13.6% |
| Spanish Americans | 0.0 /100 | #312 | Tragic 13.6% |
| Cree | 0.0 /100 | #313 | Tragic 13.7% |
| Blacks/African Americans | 0.0 /100 | #314 | Tragic 13.7% |
| Puget Sound Salish | 0.0 /100 | #315 | Tragic 13.7% |
| Pima | 0.0 /100 | #316 | Tragic 13.7% |